Problem Set 1 - Answers
(due Monday, January 9)
1. Let's compare the 10 recessions that the U.S. has experienced since the
end of the WWII. Your task is to complete the table below (parts a. through c.),
and then answer questions using the data in the table (parts d through f).
Beginning (Peak)
(quarterly date is in parentheses) |
End (Trough)
(quarterly date is in parentheses) |
Duration
(in months) |
Cumulative Output
Fall (in %) |
Increase in Unemployment
Rate (in % points) |
| November 1948 (IV) |
October 1949 (IV) |
11 |
-1.69 |
4.1 |
| July 1953 (II) |
May 1954 (II) |
10 |
-2.56 |
3.3 |
| August 1957 (III) |
April 1958 (II) |
8 |
-3.18 |
3.3 |
| April 1960 (II) |
February 1961 (I) |
10 |
-0.54 |
1.7 |
| December 1969 (IV) |
November 1970 (IV) |
10 |
-0.17 |
2.4 |
| November 1973 (IV) |
March 1975 (I) |
16 |
-3.10 |
3.8 |
| January 1980 (I) |
July 1980 (III) |
6 |
-2.18 |
1.5 |
| July 1981 (III) |
November 1982 (IV) |
16 |
-2.63 |
3.6 |
| July 1990 (III) |
March 1991 (I) |
8 |
-1.26 |
1.3 |
| March 2001 (I) |
November 2001 (IV) |
8 |
+0.35 |
1.3 |
a. Complete the Beginning and End columns. Go to
www.nber.org click on
Recessions and Recoveries, the
NBER Business Cycle Dating Committee, and related topics then click on
US Business Cycle
Expansions and Contractions. Calculate the duration of each recession. Do
not count the peak month (the recession begins at the end of the month).
b. Complete the Cumulative Output Fall column. You can use
this spreadsheet which contains the
quarterly real GDP (this data was used to generate the first figure in packet
one). For each recession, calculate the percentage cumulative output fall by calculating the
percent change from the beginning quarter of the recession (peak) to the final
quarter of the recession (trough). For example, for the percent cumulative
output fall during the first recession was calculates as "=(B13-B9)/B9*100".
c. Finally, complete the Increase in Unemployment Rate column. You will need to
obtain statistics
on the unemployment rate in the U.S. Go to the web site of the Bureau of Labor
Statistics (BLS):
www.bls.gov. In the middle of the page you will see the latest BLS numbers.
Under the unemployment rate, click on the dinosaur icon ( )
next to the "current unemployment rate." This will take you to a table with 10
years of historical data. However, we want all of the data. Therefore, click
on "More Formatting Options" and then specify years range from 1948 to
2005 and view of
the data as "Column Format." Click retrieve data. Copy the table into Excel. For
each recession calculate the change in the unemployment rate from the beginning
(peak) to the end (trough).
)
next to the "current unemployment rate." This will take you to a table with 10
years of historical data. However, we want all of the data. Therefore, click
on "More Formatting Options" and then specify years range from 1948 to
2005 and view of
the data as "Column Format." Click retrieve data. Copy the table into Excel. For
each recession calculate the change in the unemployment rate from the beginning
(peak) to the end (trough).
d. In your view, which recession has been most severe? Explain. (Note that the answer
depends on your subjective weighing of duration, output fall and unemployment.)
In my view, the recession of 1973 stands out as the most severe. It is one of the two
longest post-war recessions and has the second largest drop in output and the
second largest increase in the unemployment rate. While the 1957 recession
experienced a greater output fall, it was only half as long as the 1973
recession. Similarly, while the 1948 recession experienced a greater increase in
the unemployment rate, output fell by only half of the percentage of
1973. In summary, the 1973 recession was severe on all counts: duration, output
fall and the increase in the unemployment rate.
e. How does the most recent recession compare in severity to others?
By many measures the 2001 recession is the mildest recession on record.
Its duration was only 8 months which makes it the second shortest. Output actually
increased during this recession (!) which is unprecedented, and the increase in
the unemployment rate was the lowest (tied only with the 1990 recession).
f. The recession known as the "Great Depression" started in August 1929 and
ended in March 1933. During that time GDP fell by nearly 50%, and the unemployment
rate went from 3% in 1929 to nearly 25% in 1933 . Given what you now know
about other recessions, do you think that the recession of 1929-1933 deserves
the "Great Depression" name?
Absolutely. The Great Depression lasted 43 months, nearly three times
as long as the longest post-WWII recession. The cumulative drop in output was nearly 16 times larger than during the worst post-WWII recession. Most
striking, however, is the increase in the unemployment rate by 22 percentage
points which is five times more than during the worst post WWII recession. In
summary, the Great Depression stands out as a truly exceptional decline in
economic activity.
2. The table below shows per capita GDP in 2004 and the annual growth of
per capita GDP over the last 25 years for selected countries. (A complete list
of countries is available
here.) Answer the following questions:
| Country |
GDP per capita in 2004 in
2000 PPP dollars |
Growth in GDP per capita
between 1980 and 2004 in % per year |
| China |
1,162 |
8.26 |
| U.S. |
36,790 |
2.06 |
| Mexico |
5,968 |
0.67 |
a. If over the next 25 years the Chinese economy grows at the same rate as it did during the last 25 years, what will its level of GDP per capita
be? (Hint: GDP per capita
in China next year would be 1,162*(1 + 0.0826), two years from now it would be
1,162*(1+0.0826)2 and x years from now 1,162*(1+0.0826)x .)
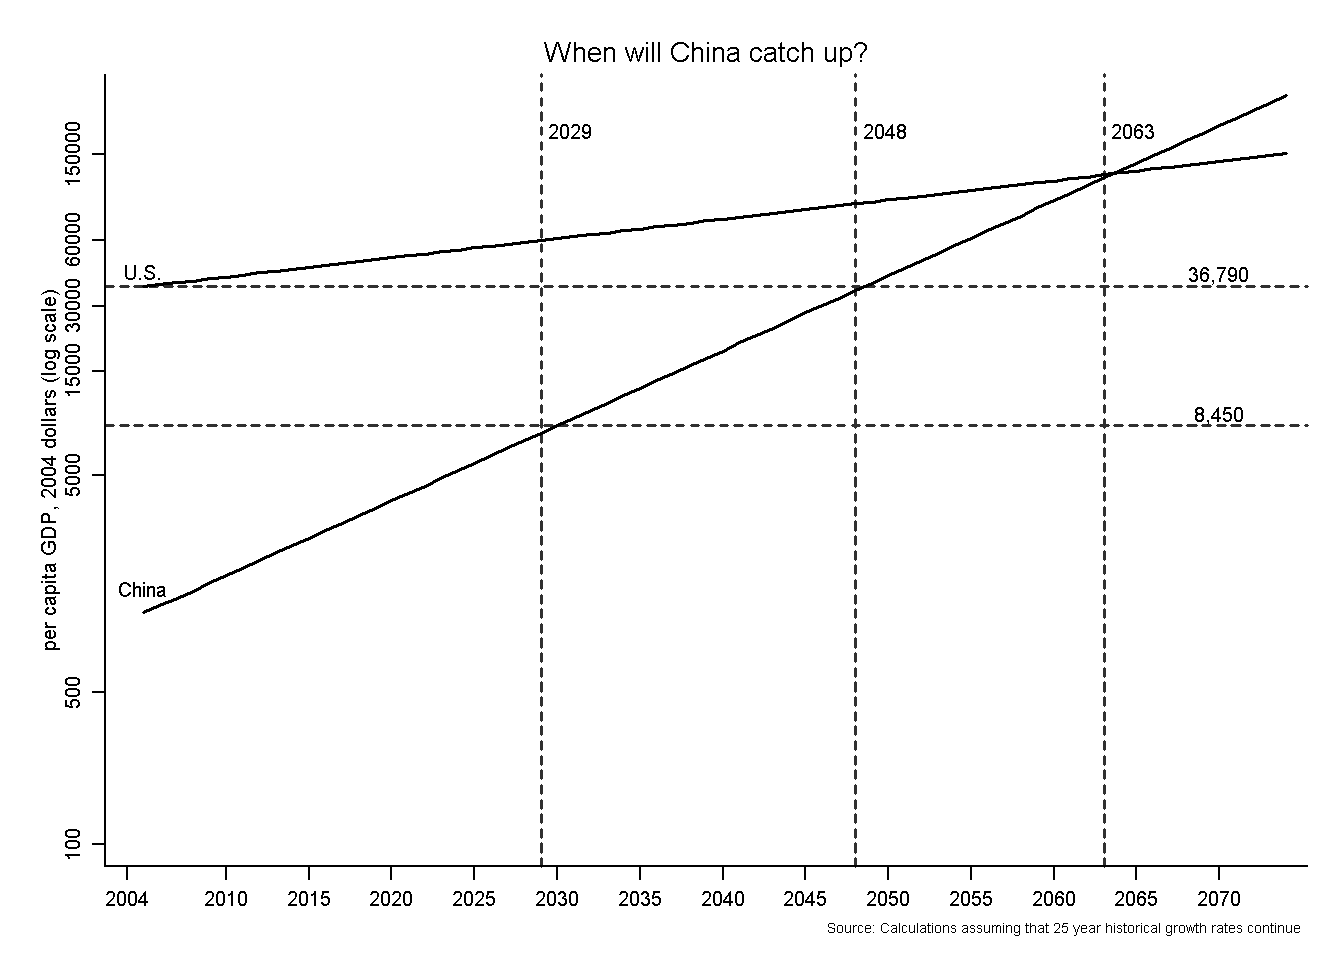
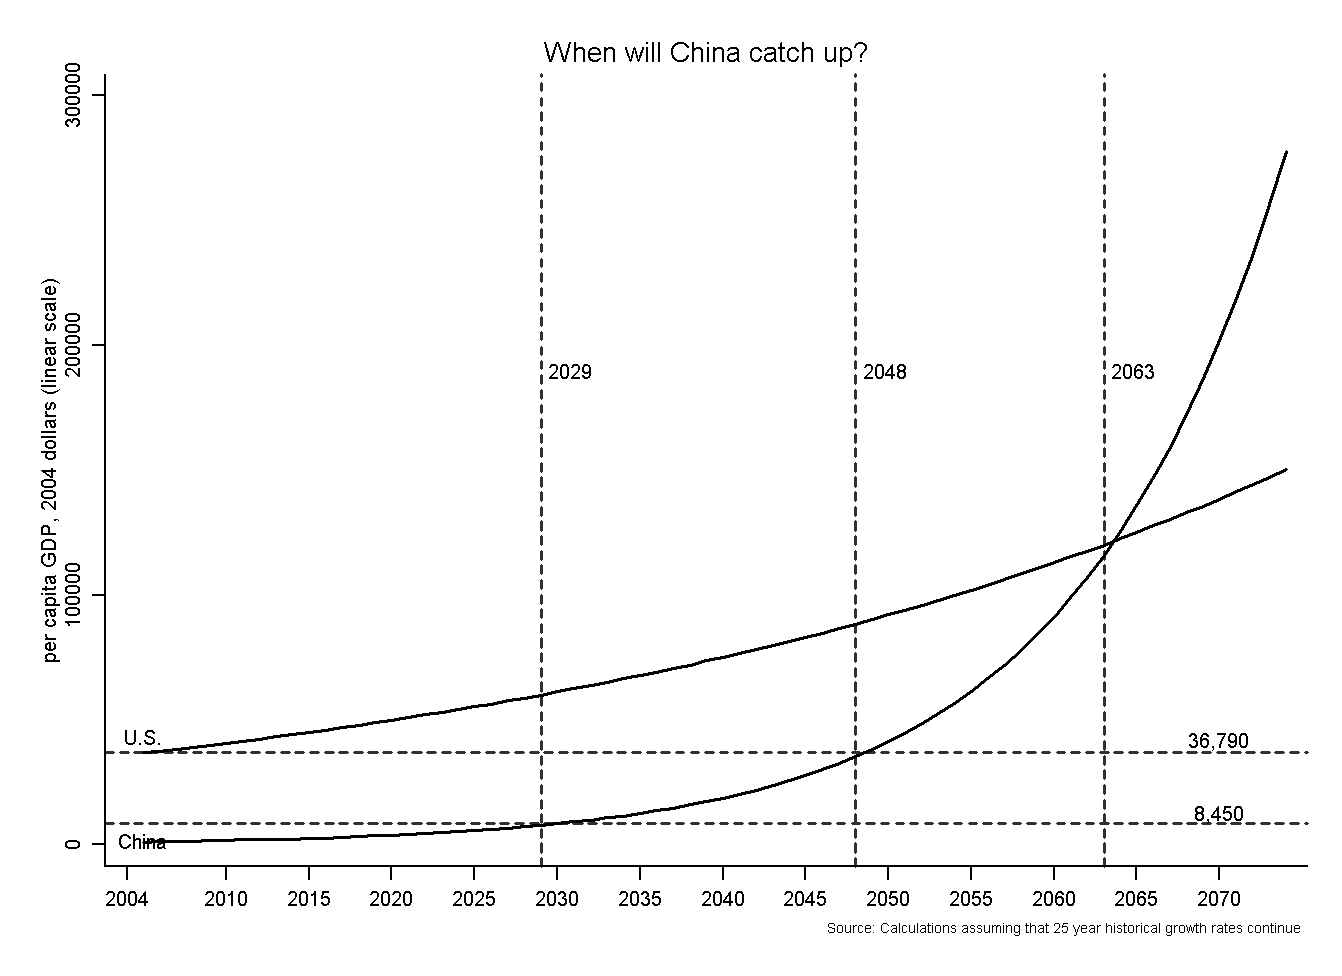
If China were to grow at the same rate as it did during the last 25 years, in
the next 25 years its GDP per capita will be 1,162*(1.0826)25=8,450,
i.e. about the current level of Portugal.
b. If China grows at the same rate as it did during the last 25 years, when
will it achieve the current level of U.S. GDP per capita? (Hint: You will also
need to refresh your equation solving skills. In particular, recall that when
solving an equation you can manipulate your equation by taking the natural logarithm
of both sides. Also, recall that ln(ax)=x*ln(a).)
We need to find x so that
1,162*(1.0826)x=36,790
1.0826x=31.66
x*ln(1.0826)=ln(31.66)
x=43.5
If China were to grow at the same rate as it did during the last 25 years, it will
take less than 44 years for China to achieve the current level of GDP in the
U.S.
b. If both China and the U.S. grow at the same rate as they did during the last
25 years, how many years will it take for China to have a per capita GDP equal to
that of the U.S.?
We need to find x so that
1,162*(1.0826)x=36,790*(1.0206)x
1.0826x=31.66*1.0206x
x*ln(1.0826)=ln(31.66)+x*ln(1.0206)
x=59
It would take about than 59 years for China to catch up with the U.S.
c. If both the U.S. and Mexico grow at the same rate as they did during the last
25 years, will Mexico ever catch up with the U.S.? Will the gap between the U.S.
and Mexico narrow or widen?
Mexico grows at a slower rate than the U.S. Therefore, if
the current trend continues, Mexico will never catch up with the U.S. Instead
the income gap between the two countries will widen.
d. If China and Mexico grow at the save rate as they did during the last 25
years, when will China be richer than Mexico?
We need to find x so that
1,162*(1.0826)x=5,968*(1.0067)x
1.0826x=5.136*1.0067x
x*ln(1.0826)=ln(5.136)+x*ln(1.0067)
x=22.5
It would take only 23 years for China to catch up with Mexico.