Ice Jams inferred from tree scars made during the 1996 mid-winter flood on the Mohawk River (New York)
Jason R. Lederer
John I. Garver, Ph.D.
Geology Department
Union College
Schenectady NY 12308 (USA)
(518)-388-6517
Version 1.2 - March 2008
ABSTRACT
The January 19-20, 1996 flood in eastern New York resulted from unseasonably warm temperatures, heavy rains, and rapid snowmelt. The thaw-induced breakup flood was characterized by severe ice jams along the lower reaches of the Mohawk River. As the ice floe moved through Schenectady it caused excessive damage to trees and other structures along the river edge and it is clear from eyewitness accounts that the ice floe had jammed in this area. Based on discharge data from the U.S. Geological Survey monitoring station at Cohoes (~20 km downstream), we interpret two times when ice dams formed with a clear downstream decrease in discharge. One ice dam formed around 12:15 AM and broke around 02:15 AM, the second jam formed around 06:15 AM and broke around 07:00 AM. Crest occurred at 09:15 AM on 20 January. Elevation of ice scars on trees lining the river banks allow reconstruction of ice elevations and from these data, jam points may be inferred. The highest ice scar elevations occur between Lock 8 and the Stockade in Schenectady, and almost no abrasion occurs below the Rexford Bridge. Two possible jam points may be inferred from the data based on rapid downstream elevation changes of the highest ice damage. One sharp elevation increase occurs between the Freemans Bridge and the D&H railroad bridge where ice scar elevation increases from ~224 feet to ~226 feet. Another sharp elevation drop occurs upstream of the still-standing abutments of the old Burr Bridge (a.k.a. “Scotia Bridge” after reconstruction) where maximum ice scar elevations increases from ~226 feet to ~230 feet. We infer that the ice dam at the old Burr Bridge broke shortly before the flood crest based on the fact that the maximum elevation of ice scaring just downstream in the Schenectady Stockade (228.4 feet) falls just short of height of the river at crest (229.5 feet). Both jam points occur where anthropogenic activity has dramatically restricted the flood plain thereby causing a severe restriction in flow. Monitoring devices in the river could provide near-real time data on flood water levels that would greatly aid emergency response.
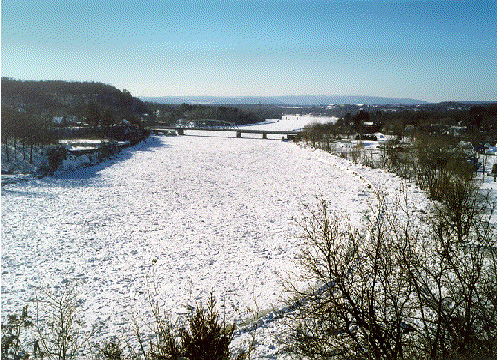
Photograph taken in during an ice jam in 1999. This view is of the Rexford Bridge looking west.
Jam is lodged in the Niskayauna pool just downstream from this point (see map below) (J.I. Garver).
INTRODUCTIONDuring the last decade, flooding has resulted in billions of dollars of damage across the country. Most notable was the Mississippi flood of 1993 and the floods in North Carolina following Hurricane Floyd in 1999. Floods of some magnitude occur every year, and generally they can be ascribed to high runoff from winter thaw, sub-tropical depressions, of abnormal rainfall in unusual meteorological disturbances. In northern latitudes, some of the worst flooding tends to be dominated by “breakup” events that generally herald the onset of spring, but sometimes occur in mid-winter. In these flood events, total water budget includes meltwater of snow and ice build-up over the winter months, and precipitation during the event. In these drainages, a particularly serious hazard results from ice floes, which are flushed through the system when snow melts, runoff increases, and the river rises.
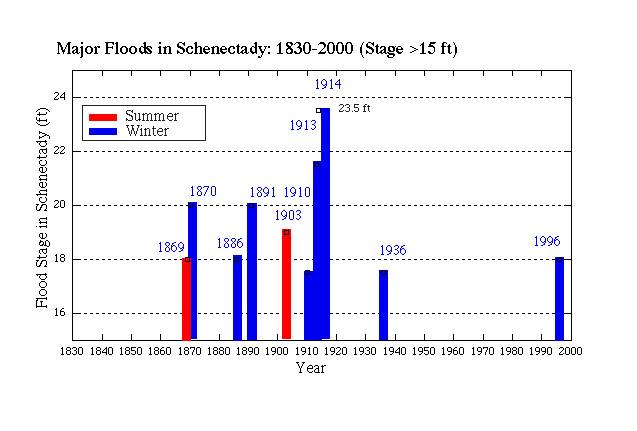
Ice floes can coalesce and get jammed at narrow points along a river’s course. When this happens, water can get backed up behind the ice jam, rising at spectacular rates. Flooding and ice jams on the Mohawk River have been recorded since settlement of Schenectady by the Dutch in the mid 1600s. Our focus here is on the Schenectady area because it has the longest historical record of river levels of any community along the Mohawk River (Garver, in prep.). Historical records suggest that some of the worst ice jam floods occurred in the late 1800s and early 1900s. In most cases, the worst events involved an unusually thick ice cover on the river (~18” to 22”), a rapid melt coupled with some precipitation. About 80% of the most severe flood events on the lower Mohawk River have been associated with ice jamming (the rest being open-water floods). Major breakup floods with ice involvement occurred in 1832, 1865, 1870, 1886, 1891, 1893, 1913, 1914, 1936, 1964, and 1996 (Fig. 3). Note that most of these flood events preceded installation of the lock and canal system (1916 -1917 to present).
One of the worst ice jams in recent history occurred on 13 February 1886 when a spectacular ice gorge formed and lodged in and around the islands near Schenectady (Fig 6). In this event, one-foot-diameter trees on the flood plain were reportedly snapped in half, and when the water receded, the remaining ice was piled some 30 to 40 feet high (The Evening Star, 15 February, 1886). During the 1886 event, ice jammed at the Scotia Bridge which linked downtown Schenectady with the Village of Scotia.
Commonly, ice jams can result in spectacular rapid rates of water rise. In March 1964, the Cohoes Monitoring Station recorded greatest hourly flow ever recorded on the Mohawk River. Discharge peaked at 143,000 cubic feet per second (c.f.s.), although the mean discharge for the day was about half this level. In comparison to other floods on the Mohawk River this was not a big event, but the ice jam that formed resulted in very high water levels for a short time: the high discharge was due to an ice jam that formed and subsequently burst releasing the backed up water. The water level at the peak hour that day was essentially a 24-foot-high wall of water cascading over the dam (Gara, 1998). This ice event nicely demonstrated to emergency personnel just how rapidly and dramatically ice dams can affect river discharge.
The highest recorded flood level in Schenectady’s recorded history occurred during the March 1914 breakup event. A heavy thaw followed a 32” blizzard earlier in the week, probably from a Nor’easter. The sudden surge of meltwater resulted in an ice jam at the Scotia Bridge connecting the Stockade of Schenectady with Scotia, NY. The water rose in the Stockade to 231.1’, almost 10 feet over the banks. The resulting water pressure behind the ice jam destroyed Freemans Bridge and then took out the larger Rexford Bridge downstream, effectively cutting parts of Schenectady off from its rural district to the north for three years (Van der Bogart, 1978).
In a survey of the past ice jamming episodes, we have come to the simple conclusion that any restriction or narrowing of the flood plain is a possible jam point. Inferred jam points occur at many places along the river, and some are well known to local emergency management authorities. However, there is a general lack of information as to the significance of individual jam points, and how often jams occur in different areas. In addition, many jam sites are inferred based on little data. Because of the severity of flood events associated with ice damming, it is important to gain a better understanding of where they occur.
Unfortunately ice jamming and the resulting changes in flood levels has not been well documented in the past and the best record is that published in local newpapers after each event. The most recent severe flood event which occurred on January 19th and 20th 1996 is fairly well documented and serves as a good case study. The 1996 event was a mid-winter thaw event that result in the breakup of the Mohawk River (See WRGB Climate archive for this month). Heavy rains and rapid snowmelt and runoff accompanied the thaw. As recorded at Cohoes, the event resulted in a mean discharge for the day of 92,600 c.f.s. with a peak discharge of 132,000 c.f.s. (Gara 1998) resulting in extensive flooding of the Stockade area of Schenectady. Hard hit during this event were parts of the Schoharie Valley along the Schoharie River, which is the main tributary to the Mohawk River.
It is quite apparent that ice jamming has accompanied the worst flooding in the history of Schenectady and other communities along the lower reaches of the Mohawk. The goal of this research project to understand how ice dams relate to flooding on the Mohawk River and how these ice jams pose a hazard for Schenectady and surrounding low-lying areas. To accomplish these goals we use the 1996 event as a case study for how ice jams developed during the event. With a better knowledge of jam points, automated monitoring devices may allow a more effective emergency response when these events occur.
Background
Dendrochronological and tree scar analyses have been successfully applied in various fields to reconstruct both frequency and magnitude on many natural processes (Tardif and Bergeron, 1997; Alestalo, 1971; Shroder, 1981: Schweingruber, 1988; Fritts and Swetnam, 1989). Paleoflood characteristics may be recorded by historical, botanical, or geologic indicators (Fanok and Wohl, 1997; Wohl and Wnzel, 1995). Tree scars have been shown to be a proxy indicator of flood levels and ice elevation during flooding (Tardif and Bergeron, 1997: Harrison and Reed, 1967; Smith and Reynolds, 1983; Begin and Payette, 1988; Grottensfeld and Johnson Grottensfeld 1990)*. Ice scars result from the impact of ice to the tree, which locally (generally the upstream side) destroys the cambium or wood-producing tissue. Growth in the area of impact temporarily ceases, thereby recording the date and the height of the damage. Eventually, the callus (undamaged tissue) begins to grow in annual increments over the scar (Fanok and Wohl 1997; Hupp, 1988). The scar may be physically evident for a number of years, depending on the growth rate of the tree, but eventually the outward expression of the scar diminishes (Fanok and Wohl 1997). Analysis by Tardfi and Bergeron (1997) demonstrated that scar frequency rather than scar height is a better indicator of past spring floodwater levels on the Harricana River in Northern Quebec. Here, tree scars show a good correspondence between observed scar abundance and the high river discharges recorded in the spring season of multiple years. Conversely, it was found that no scars were found during years of low Harricana River maximum discharge (Tardif and Bergeron, 1997).
Regional Setting
The Mohawk River is located in upstate New York (Schenectady is 42°, 45’N; 73°; 48’W) between the Adirondack Mountains to the north and the Catskill Mountains to the south. The principle tributaries of the Mohawk River drain the Catskill Mountains to the south and part of the flanking regions to the southern Adirondacks to the north. The largest sources of regional precipitation during the summer are land-recycled moisture combined with Gulf and subtropical Atlantic Moisture driven by west-to-east-moving frontal systems. The largest source of winter precipitation includes Atlantic-derived moisture organized into storms that moves up the North American Atlantic seaboard in the form of Nor’easters. A smaller source of winter precipitation is lake-effect snow-belts extending from the Great Lakes to about central New York which occasionally deliver accumuable significant moisture as far east as the Mohawk Valley, but mainly to the western part of the state. Large snowfalls by Nor’easters and subsequent warm conditions induced by the south-derived air mass are the principle triggers for catastrophic spring breakup floods on the Mohawk River.
The Mohawk River bank margin area is predominantly lined with Eastern Cottonwood (Populus deltoides) and Silver Maple Trees (Acer saccharinum). These trees serve as good proxy indicators, as they are very tolerant to flooding and high water according to Bell and Johnson (1974). Beyond wooded vegetation, the study area is underlain by low-lying brush and grasses.
Methods
Our primary methodology involved measuring the elevation of tree scars caused during the 1996 event (Fig. 4, a, b, c). Although the focus was on the January 19 - 20 1996 ice event, data collection also included tree abrasion from the March 30-31, 1993 event and the January 19, 1999 event - both were of much smaller magnitude (ice scar heights are 2-6 feet lower). The 1996 event was selected as a model because it caused the worst flooding in the Stockade area of Schenectady, NY since 1936 and the scars were easily accessible. As a result of the severity of the flooding and the ice jamming and because it was fairly recent, written and verbal accounts of the ice event are readily available.
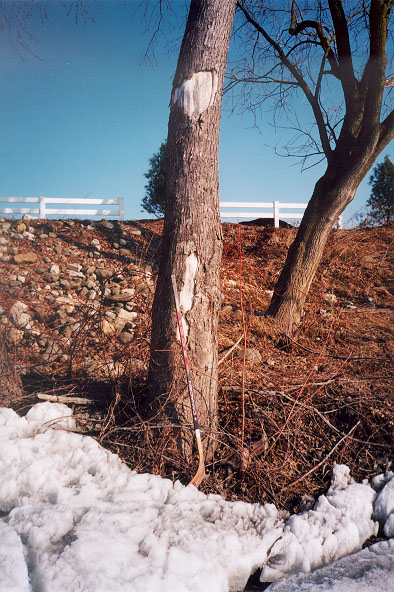
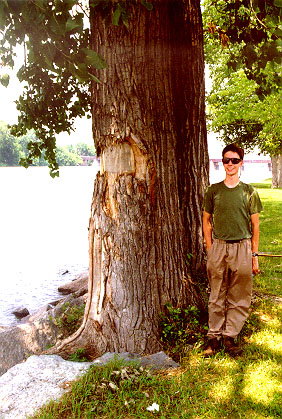
Tree in front of the Glen Sanders Mansion with ice scars from the 1996 event.
Note hockey Stick for scale. The elavation of these scars are about 15 feet
above normal river level. Both the lower scar and the upper scar were made
in the same event.Surveying tree damage involved systematically measuring the elevation of ice scars on individual trees lining the river. By examining the healing rings around the ice scar, 1996 damage could be separated from older (1993) and younger (1999) tree abrasion. In most cases, scarring results in the removal of some or all of the bark and commonly some of the underlying wood (Fig. 4 a, b, c). In our experience, typical ice scars heal in about 10 years on Maple Trees (Acer) which are common along the riverbanks in this area.
Data collection was concentrated in a 10-mile (22 km) stretch of river between Lock 8 and Lock 7 and reconnaissance was done upstream and downstream from this pool. The study area was divided into twenty sites with each number designating a specific location and each tree measured having an individual identification number. Methods of surveying included approaches from both land and water. Trees accessible only by water were approached on the Research Vessel (RV) Nott pontoon boat, which served as the on-site laboratory. A 13-foot stadia rod with 1/10-foot intervals, and an eye-leveling site were used to survey elevation of scars. Corrections were applied to the data to account for daily fluctuations in the Lock 7 pool of water. Maximum variation during the study period was one foot. River measurements are made twice daily at the Lock 7 Vischer Ferry Dam in Colonie, NY (Fig. 6). These two measurements were averaged to find mean daily elevation of the Mohawk River.
Results
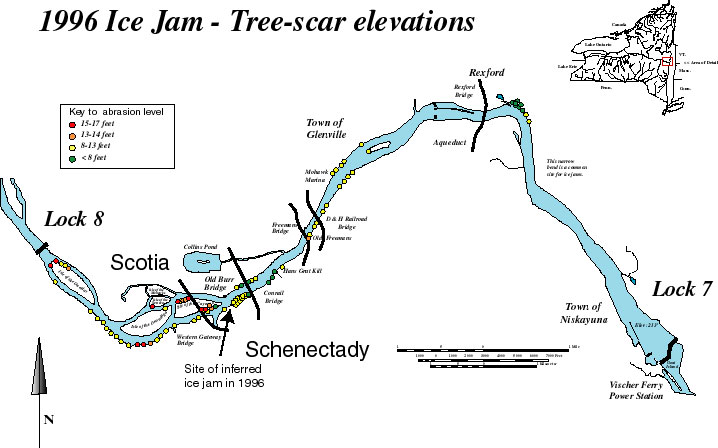
As water levels rise behind an ice dam, ice floating on the water will rise as well. As ice builds up and becomes tightly packed behind the dam, the elevation of the water level is recorded on the trees. Between Locks 6 and 9 the only place where significant ice scarring occurs on bank-margin trees is in a 5 mile stretch between Locks 7 and 8: this damage is concentrated on trees between the Freemans Bridge (approximately 1 mile downstream from the Schenectady Stockade) and Lock 8 (Figs. 6,7). Maximum elevations of the 1996 ice scars from Lock 7 and 8 shows a clear picture of downstream changes in ice jam levels (Figs. 6,7). These data define downstream steps that indicate two points where the maximum abrasion elevation decreases abruptly. In interpreting the ice scar data, we assume that the highest elevation of ice scarring records the maximum elevation ice reached during an ice jam and lower points are less significant. The stepped decrease in maximum elevation at specific locations downriver may be attributed to ice dam formation.
Based on the elevations of tree abrasion formed during the 1996 event, we infer that two ice dams formed between Lock 7 and Lock 8. One formed between Freemans Bridge and the D&H railroad bridge creating a change in maximum ice scarring on the order of 2 to 2.5 feet (a jump from 224 feet downstream to 226-226.5 feet upstream). This is a relatively low level in the context of the entire event.
Another higher ice dam formed at the site of the old Burr Bridge abutments, resulting in ice scar levels to rise of 4 to 4.5 feet (a jump from ~226 feet downstream to ~230-230.5 feet upstream). At this location, the river constricts dramatically as two channels converge after meandering around a series of islands (Fig. 6). In addition to the channel narrowing, it also becomes somewhat shallower due to sediment deposition on the downstream side of the Isle of the Cayugas (Fig. 6). This ice jam resulted in the highest level of ice scarring, some of which was over sixteen feet above normal river level.
Below the Rexford Bridge at the Niskayuna pool (Fig. 6), there is no evidence for significant ice jamming. Although local residents believed this area was a jam point, our data does not confirm this perhaps because there are few trees along this cliff-banked stretch of river. Therefore, because there are so few trees we cannot rule out formation of an ice gorge in this stretch of the river. However, what scars we did see in this area are rather low (circa 8’)
In interpreting tree scar levels made during the 1996 event, a crucial piece of information is the discharge record from the U.S. Geologic Survey station (approximately 20 km downstream at Cohoes). The hydrograph clearly shows the development of the entire event (Fig. 5), but note two periods of a decrease in discharge on the rising limb of the hydrograph: these represent a period of falling discharge at the Cohoes Monitoring Station while the flood built toward crest. These excursions can be interpreted to be caused by ice dams upstream from the monitoring station. The effect of ice jams on a hydrograph has been recognized in controlled experiments (Lever et. al., 1997). It seems clear that two ice dam events preceded peak discharge therefore occurred during rising water, prior to crest. The first event began around 00:15 AM and ended at approximately 02:15 AM (120 minute duration). The hydrograph shows an extremely rapid rise in discharge after the ice dam broke (Fig. 5). The second ice dam, which began at approximately 06:15 AM and ended at around 07:00 AM (45 minute duration) was shorter lived, but because of the already high river levels could have resulted in the highest levels of the entire event. Maximum discharge occurred soon thereafter at 09:15 AM on January 20, 1996 reaching 132,000 c.f.s. at Cohoes Monitoring Station (see Gara 1998).
The maximum elevation of 1996 ice scarring in the Stockade is 228.4 feet and the elevation of the river at its crest was 229.5’. It is likely that the jam that caused 228.4’ abrasion occurred near the time of the crest of this event. Therefore, it is possible that this jam occurred between 06:15 and 07:00 AM Jan. 20, 1996 and the jam lasted for 45 minutes. Fortunately, the jam broke and the river only continued to rise for a short time following, otherwise damage would have been much more severe upstream.
Conclusions and Discussion
Breakup floods pose a significant threat to residents and property along the Mohawk River. During these events, catastrophic ice jams are possible when the ice is unusually thick (15+ in.), and is accompanied by abnormally high runoff from snow melt, ice melt, and precipitation. However, ice jam occurrences are not limited to times thick ice cover, but historically it seems that thicker ice cover results in more serious jamming. Prior to the 1996 ice jam on the Mohawk, ice thickness was only about 12-13 inches. Ice dams can cause extremely rapid and spectacular rises in water levels: rises as fast as eight feet in two hours (break up flood of 1914). Unfortunately these rapid rises in water levels give emergency response teams little time to warn residents and evacuate the flood plain.
Graph showing the hydrograph for the 1996 event. Data from the U.S.G.S.
hydrograph at Cohoes (~20 km downstream)
Data from the 1996 event suggest that the constriction at the abutments of the old Burr Bridge and the constriction downstream of the Freemans Bridge (perhaps the old Freeman’s Bridge abutments which are between) were sites of short-lived ice dams. The highest ice scarring elevations occur upstream of the Schenectady Stockade at the Isle of the Oneidas to Lock 8 (Fig. 6,7) where ice scar levels are as high as 16 to 17 feet. Fortunately, the area is less populated than some downstream sections and houses lie higher on the flood plain, the damage was less extensive in 1996 than it could have been especially if the ice was thicker. However, if jams like this are able to persist, danger exists downstream as well because a fast-moving wall of water can result from a burst dam.Unfortunately it is very difficult to control ice floes and preventing them from jamming in a river by conventional methods. One such attempt involves and ice control structure consisting of massive sloped blocks, partially buried in riprap, placed across a river adjacent to the natural floodplain (Lever et al. 1997). At the present, there is no adequate way to resolve the ice jam hazard of the Mohawk River. The only solution for dealing with the problem is to monitor flow in such a way as to warn residents along the floodplain in time for them to move valuables and themselves to higher ground and prepare for a flood. This is generally the same area that jammed in the February 2000 event where active monitoring during the event indicated a nine foot backup of water behind the jam (pers. comm).
Ice Scar along the Mohawk River in the Stockade of Schenectady.
Here the elevation of the ice was about 10 feet above the river
during the 1996 event.
Monitoring river levels during severe floods is dangerous, time consuming, and difficult, especially at night and when access to monitor points is restricted. Currently, flood waters are monitored by the Radio Amateur Civil Emergency Services (RACES) a volunteer group in coordination with Schenectady County Emergency Management. Installation of remotely operated, real-time, pressure transducers near potential jam points along the river would allow nearly instantaneous response in the event of severe flooding resulting from ice jams. These catastrophic ice jams have happened in the past, and they will happen again.
AcknowledgementsThis research was funded by the National Science Foundation Grant EAR 9809765 (Garver and others). The Union College Geology Department, Union College Schenectady, NY is acknowledged for assistance and use of resources during this project. Mark Hopkins at Cold Regions Research and Engineering Laboratory offered valuable advice and discussions with engineering related questions. Finally, we would like thank you to local residents, namely Helen Witts and the Duggins, along the Mohawk River for their willingness to be interviewed during this project.
References
Alestalo, J. 1971: Dendrochronological interpretation of geomorphic processes. Fennia 105. 1-140
Begin, Y. and Payette, S. 1988: Dendrochronological evidence of lake-level changes during the last three centuries in subarctic Quebec. Quaternary Research 30. 210-20.
Bell, D. T., and E L. Johnson. 1974: Flood-Caused Tree Mortality Around Illinois Reservoirs. Trans. Ill. State Academy of Science Vol 67 (1): 28-37.
The Evening Star, Schenectady, New, York, 1886
Fanok, S., and Wohl, E. 1997: Assessing the Accuracy of Paleohydrologic Indicators, Harpers Ferry, West Virgina. Journal of the American Water Resources Association. Vol 33 (5): 1091-1102.
Fritts, H.C. and Swetnam, T.W. 1989: Dendrochronology: a tool for evaluating vegetation in past and present forest environments. Advances in Ecological Research 19. 111-188.
Gara, J. 1998: Historical Record of Flooding on the Mohawk River, New York. Unpublished Research Report. Union College Geology Department, Schenectady, NY.
Gottesfeld, A.S. and Johnson Gottesfeld, L.M. 1990: Floodplain dynamics of a wandering river, dendrochronology of the Morice River, British Columbia, Canada. Geomorphology 3. 159-179.
Harrison , S.P. and Reid, O.E. 1967: A flood-frequency graph based on tree-scar data. Proceedings of the North Dakota Academy of Science 21. 23-33
Hupp, C.R., 1988. Plant Ecological Aspects of Flood Geomorphology and Paleoflood History. In: Geomorphology,
V.R. Baker, R.C. Kochel, and P.C. Patten (Editors). John Wiley and Sons, New York, New York, p. 335-356.
Lever, J. H., Gooch, G., Tuthill, A., and Clark, C. 1997: Low-Cost Ice-Control Structure. Journal of Cold Regions Engineering. Vol 11 (3): 198-220.
Luey, K., and Garver, J. 1999: A Chronology of Major Floods on the Mohawk River in Schenectady: 1832 to 1903. Unpublished Research Report. Union College Geology Department, Schenectady, NY.
Schenectady Gazette, Schenectady, New York
Shroder, J.F. Jr. 1981: Dendrogeomorphology: review and new techniques of tree-ring dating. Progress in Physical Geography 4, 161-188
Smith, D.G., and Reynolds D.M. 1983: Tree scars to determine the frequency and stage of high magnitude river ice drives and jams. Red Deer Alberta. Canadian Water Research Journal 8. 77-94.
Schweingruber, F.H., 1988: Tree rings: basics and applications of dendrochronology. Dordrecht: Kluwer Academic Publishers.
Tardif, J. and Bergeron, Y. 1997: Ice-flood history reconstructed with tree rings from the southern boreal forest limit, western Quebec. Holocene. Vol 7 (3): 291-300.
Wohl, E.E. and Y. Enzel, 1995. Data for Paleohydrology. In.: Global Continental Paleohydrology, K. Gregory, L. Starkel, and V.R. Baker (Editors). John Wiley and Sons, Chichester, UK., pp. 23-59.
http://www.crrel.usace.army.mil/crrel-divisions/ice-eng/icejam/icejam.html
http://www.crrel.usace.army.mil/crrel-divisions/ice-eng/homepage.htm
http://www.ucmp.berkeley.edu/glossary/gloss8botany.html
Shen, Hung Tao. Ice in Surface Waters. A.A. Balkema/Rotterdam/Brookfield; 1998.
The Schenectady Union-Star Newspaper
Funded, in part, by the National Science Foundation

© Geology Department, Union College, Schenectady N.Y. 12308-3107.
© Environmental Science and Policy Program, Union College, Schenectady N.Y. 12308-3107. All rights reserved. No part of the document can be copied and/or redistributed, electronically or otherwise, without written permission from the Director of the Environmental Studies Program, Union College, Schenectady NY, 12308-2311, USA.
This document can be located from http://minerva.union.edu/garverj/mohawk