Ice Jams on the lower Mohawk River (Crescent, NY) formed during the 2000 mid-winter flood
Jason R. Lederer and
John I. GarverGeology Department
Union College
Schenectady NY 12308 (USA)
(518)-388-6517
INTRODUCTION
Ice jamming is an important natural hazard on the lower reaches of the Mohawk River in Schenectady, Saratoga, and Albany counties (eastern New York State). Natural features including river bathymetry, channel properties (width, bends, etc.), in addition to ice characteristics (thickness, temperature, rate of breakup, etc.) all factor into the severity ice jamming and associated flooding. Ice scarring on river-lining trees results from slow moving tightly packed ice; otherwise ice remains in the thalwag and gets flushed through the system. During the breakup flood of 1996, the city of Schenectady experienced the fourth highest river stage and severe flooding in the low-lying areas along the flood plain. Research based on scar elevation indicated that two ice jams formed piggyback on one another (Lederer and Garver, 1999). The ice jams formed where natural and anthropogenic features in the channel constricted ice flow.Ice floes commonly coalesce and get jammed at narrow points. When this happens, water can get backed up behind the ice jam, rising at spectacular rates. Flooding and ice jams on the Mohawk River have been recorded since settlement in the mid 1600s. About 80% of the most severe flood events on the lower Mohawk River have been associated with ice jamming (the rest being "open-water" floods). Major breakup floods with ice involvement occurred in 1832, 1865, 1870, 1886, 1891, 1893, 1913, 1914, 1936, 1964, and 1996. The Ice Jam of 2000 was not a large one by historical standards, but it does provide insight into jam locations and the potential hazards from these jams.
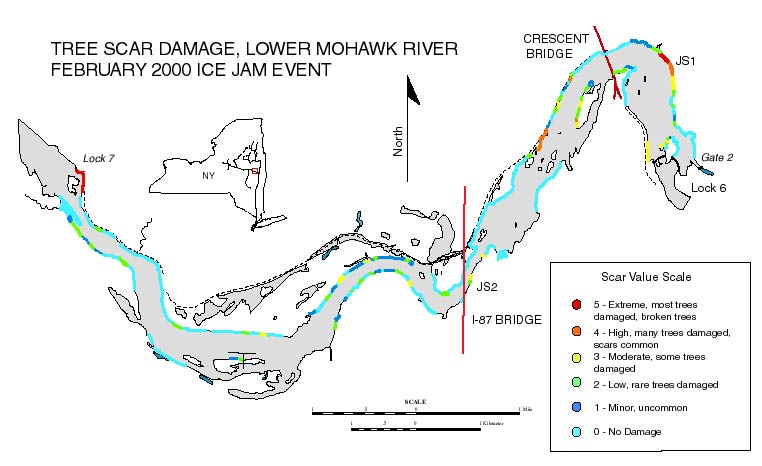
To understand the ice jams that occurred in February 2000, we evaluated ice scars on bank-lining trees in the affected area (Lederer and Garver 1999). Our previous research was successful in determining the location of two major ice jam points that were likely responsible for the severe flooding of the Schenectady Stockade during a 1996 ice jam event. The ice jam event on 28 February 2000 resulted in flooding of the low-lying areas along the lower Mohawk River, with the worst flooding occurring downstream from Schenectady in the town of Halfmoon, so this research is focused between Lock 7 and Lock 6 (Fig. 3). The media accounts of the location of the flooding indicates that the worst flooding occurred at the Crescent Bridge approximately 6 miles downstream from Lock 7 (i.e. The Daily Gazette, 1 March 2000).
METHODS
In determining the location of the worst ice jamming that occurred during the February event, a method was developed that is designed to rate the abundance and magnitude of ice scarring on river-lining trees. Damaged was assigned to a scale where a numerical value of 0 - 5 was used to rate the scarring (Scar-value scale [SVS]) (Figs. 1-3). The following relative scale was assigned in the field:
(0) no damage;
(1) minor uncommon damage;
(2) low, rare trees damaged;
(3) moderate, some trees damaged;
(4) high, many trees damaged, scars common;
(5) extreme, most trees damaged, broken trees.
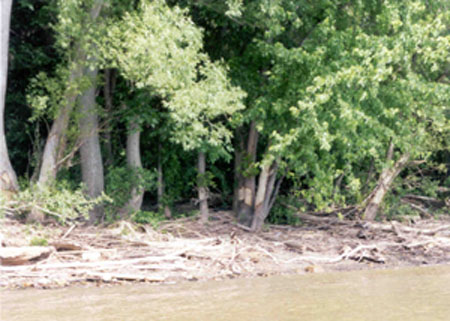
Figure 1: View along the shoreliine of the Mohawk River where the trees have experienced significant ice damage from the 2000 Ice jam. Note that many of the trees show evidence of past trauma by the bent and twisted trunks.
In addition to rating the tree scarring on the SVS, the ice scar elevations on trees in selected areas were measured to determine downstream ice elevations. Using an identical method to that used in researching the January 19-20 ice-jam event of 1996, strategic locations were chosen to determine ice elevation (Lederer and Garver, 1999).
Because an ice jam is thought to have occurred at the Crescent Bridge (I-87 Overpass), sites downstream and upstream from the bridge were chosen. Based on the elevation of tree scarring, differences in ice elevation could be determined, and extrapolated from that, the location of the ice jam fixed.
DATA
We determine jam locations based on the values on the SVS in addition to anthropogenic accounts. Where damage ranks highest on the SVS, jam site locations were inferred. The SVS data are recorded on a map of the Mohawk River study area (Fig. 3). The ice scar data is color-coded based on its SVS value. The SVS data show a major ice jam point ~1 km upstream from Lock 6.
|
2b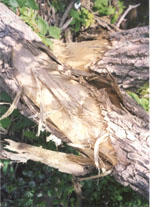 |
|
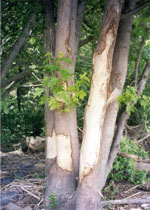
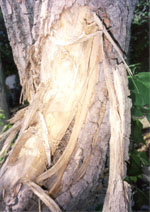
Figure 2: Three images of trees from a highly damaged area that was severely affected (SVS =5; see JS1 on Figure 3) during the 2000 ice jam on the lower Mohawk River. (a) Maple with several levels of scars; (b and c) abraded and broken Cottonwood.
There is tree scarring at other localities in the study area, but for the most part, the most abundant and severe tree scarring is confined to this area. There is abundant ice scarring directly below Lock 7. The highest ice scar elevations occur at the ice jam site near Lock 6 where SVS are 3-5 and tree damaged clearly associated with ice jamming is as high as ~8.4 and~9.6 feet above river level; (There is tree damage higher than this, however there is a degree of uncertainty as to if it is ice-related damage). Occasional low elevation scarring is abundant throughout the field area (1-3 feet above river level). The highest abrasion occurs in areas where the river has tight bends, is shallow, or has other natural constrictions.
Figure 3: Map showing the extent of ice scar damage between Lock 7 and Lock 6 on the lower Mohawk River, Eastern New York. Areas with no scar values were not accessible during the summer boating season (mainly due to thick water chesnut weeds), or are rock outcrops with no trees.
There are two main areas where ice jamming likely occurred. Media accounts record an ice jam occurring directly before and at the I-87 overpass (Jam Site 2 [JS2]) and the second (unreported) at the river stretch approximately 1 km upstream from Lock 6 (Jam Site 1 [JS1]) extending upstream and past the Crescent Bridge. SVS were low at the I-87 overpass because anthropogenic activity has modified the channel such that the south side is banked bay a concrete wall and the north side has very few trees. An area of heavy scarring occurs at the Lock 7 dam, caused by ice lodging directly after flowing over the dam. It is an ice jam site, but does not pose as a threat or flood hazard and as a result will not be discussed in this paper.
INTERPRETATION
In analyzing, ice scarring formed during the March 2000 event, it appears there are two main stretches of the river that rank high on the SVS (see data above in Fig. 3). Major ice jamming appears to have occurred approximately 1-2 km upstream from Lock 6, with associated tree-scarring extending back to nearly Halfmoon Beach (JS1). Tree scarring behind the Crescent Bridge (JS1) indicates that there was ice jam activity extending back nearly 2 km. It is inconclusive if this was the site of a separate smaller jam, however it is highly probably that the damage formed as a residual effect from JS1. The JS2 ice jam proved to be the most damaging, as it occurred in an area with relatively developed shore with dwellings and businesses lying on the flood plain.
The JS1 ice jam had the largest morphologic impact on the riverbank. Tree scars were given values as high as 5 on the SVS. Some trees were completely plowed over by ice as it rode up onto shore. Additionally, in-situ features present that resemble miniature glacial lateral and end moraines that likely formed as the ice dug into the soil and peat bank the river margin. The highest ice scar elevations (ISE) also occur in this area (4.6 - 9.6 feet above river level).
A likely cause of JS1 is twofold. One factor is the tight bend in the river that serves as a natural jam feature, similar to stretch of river upstream near Rexford (Lederer and Garver, 1999). This bend does not allow for the unobstructed flow of ice in the channel. In addition, though the channel is wide at this point, it is also very shallow in depth on the southern half of the channel. It is likely that these are the two combined factors that caused the ice jam. The owner of the Crescent Yacht Club, located at the site of the JS1, mentioned that channel dredging by the city has not occurred in at least 20 or 30 years. According to the owner, the frequency of ice jamming has increased since dredging stopped, presumably allowing for sediment infilling to occur along the river bottom. He has been victim to yearly flooding and ice damage, but cannot recall a worse, more damaging event than February 2000*.
JS2 is somewhat more difficult to interpret than the JS1 ice jam. The JS2 ice jam site does not have the diagnostics properties that are usually associated with jamming such as a tight bend in the river, anthropogenic features such as bridge abutments, constricting river flow, etc. Though the channel is narrow at this point, it is also relatively deep (10-15 m at normal conditions). At this point in the research, a correlation between river breadth vs. depth and how these factors affect ice jamming has not been established. There is evidence that two tight bends in the river between Locks 8 and 6 are frequent sites of ice jamming. Past research determined that the river bend at the Rexford Knolls (Lederer and Garver, 1999) serves as a severe potential ice jam hazard.
Downstream from the I-87 bridge, the channel returns to an average depth of ~5-8 m. It is possible that the channel depth changes resulted in an ice scoured river bottom causing ice jamming. It was difficult to measure ice scarring and SVS in this area due development and the abundance of rock outcrops.
One difficulty in determining the timing of the JS1 and JS2 ice jam is that the flood hydrograph from 28 February 2000 does not show distinctly different peaks in discharge associated with two different ice jams. The 19-20 January 1996 flood hydrograph proved useful in determining the timing of ice jams between Locks 7 and 8. We were not able to interpret accurately the 28 February hydrograph, consequently making it difficult to determine the order in which the jams formed relative to one another.
It is possible that the cause of the JS2 ice jam is a domino affect from the JS1 ice jam such that JS1 formed, resulting in JS2 forming behind it. When the Crescent Ice Jam formed, it may have affected the flow morphology of the river, such that ice jammed upstream in an area that has historically not been a problem. The morphologic characteristics of the bathymetry of the channel (as discussed above) coupled with the restricted flow resulting from the JS1 may have all played a role in the formation of the ice jam at JS2.
Generally, there is little tree scarring along the riverbanks not associated with ice jamming. Patches of shoreline where scarring is present that rank low on the SVS are likely associated with the downstream ice jams. For example, near Halfmoon Beach, the ice scarring present is associated with the large JS1 ice jam and has residual, less severe scarring behind it upstream. There is also stretch of river at Lock 7 that shows ice scaring high on the SVS. The high SVS values are associated with a small cove that lies directly after the dam. As the ice flows over the dam, it jams in this area, and though it is not serve a geologic hazard because the area is not developed, it is prone to flooding.
CONCLUSIONS
Two main ice jam points between Locks 6 and 7 affected the breakup ice floe of February 2000. The most severe of these ice jam points, JS1, did not pose a threat to dwellings, but was a hazard for the Crescent Boat Club. It is possible that dredging may alleviate some of the problems associated with ice jamming in this area, but the tight bend in the river is likely the main factor playing a role in ice jamming.
*JS2 was not as large as the ice jam at JS1. This conclusion is derived by its relatively low ranking on the SVS. It is somewhat more difficult to interpret the factors that caused the ice jam at JS2 than the ice jam at JS1, because the jam occurred in a part of the channel lacking the diagnostic features usually associated with ice jamming discussed above. Further research of the unique bathymetry of the river channel in this area may prove useful in determining if it caused the ice jam. In addition, side scan sonar may show scour marks if they are present, thus allowing for a determination if ice is scouring the bottom of the channel, at the transition zone from a deep to a relatively shallow depth.
REFERENCES
The Daily Gazette, 1 March 2000.
Lederer, Jason R. and Garver, John I. Ice Jams During The 1996 Flood On The Mohawk River Reconstructed By Ice Abrasion Damage On Trees. Union College Geology Department; Schenectady, NY. 1999. Unpublished research paper.
Luey, K., and Garver, J. 1999: A Chronology of Major Floods on the Mohawk River in Schenectady: 1832 to 1903. Unpublished Research Report. Union College Geology Department, Schenectady, NY.
Funded, in part, by the National Science Foundation

© Geology Department, Union College, Schenectady N.Y. 12308-3107.
© Environmental Science and Policy Program, Union College, Schenectady N.Y. 12308-3107. All rights reserved. No part of the document can be copied and/or redistributed, electronically or otherwise, without written permission from the Director of the Environmental Studies Program, Union College, Schenectady NY, 12308-2311, USA.
This document can be located from http://minerva.union.edu/garverj/mohawk