The 15 March 2007 Ice Jam on the Mohawk River (NY)
John I. Garver, Ph.D.
Geology Department
Union College
Schenectady NY 12308 (USA)Version 1.2 - March 2008
This is a brief summary of the main features of the March 15 ice jam that occurred in the Mohawk River in Schenectady and Saratoga Counties. The ice floes that worked their way through Schenectady were loosened by warming weather that melted a considerable snow pack and relatively well-formed ice cover. This was a moderate ice jam that produced significant flooding in the Stockade district of Schenectady. At the time of maximum backup (maximum stage elevation) in Schenectady, houses in lower areas were evacuated, power was cut, and a state of emergency was declared.
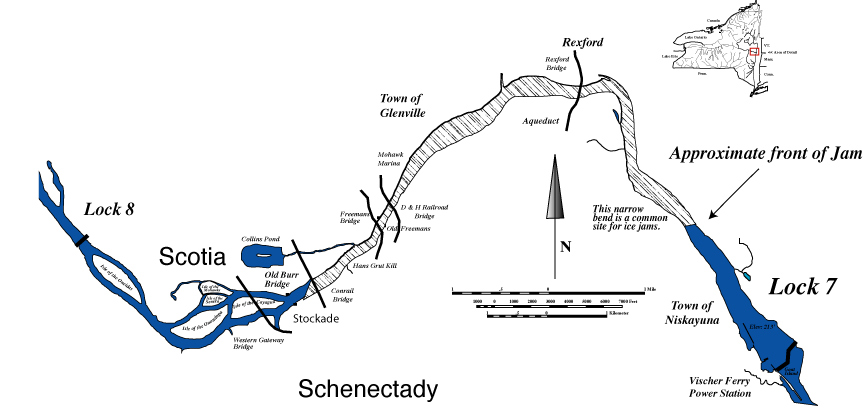
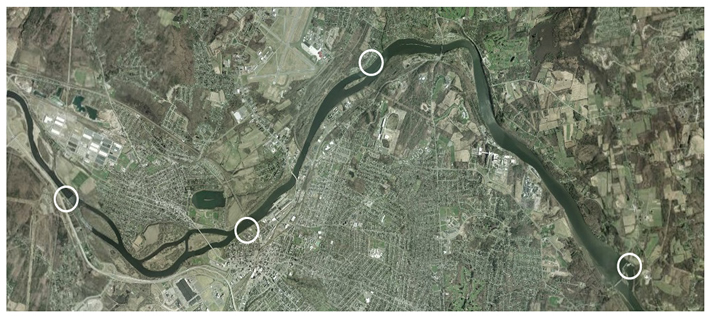
Figure 1: Map showing the approximate location of the ice jam that resulted in backed up water and flooding in the Stockade of Schenectady. The front of the ice jam is estimated but is probably within 1 km of its position. The ice jam was approximately 5-6 miles long. Note that the Cohoes station is about 19 miles downstream from the Stockade district of Schenectady.
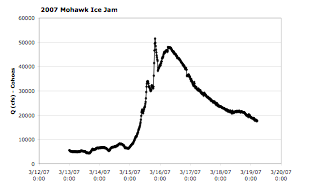
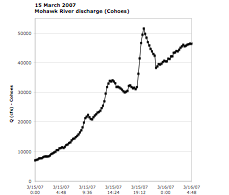
Figure 2: Discharge measurements for 15-minute intervals for the entire event between centered on 15 to 16 March, 2007. This hydrograph represents the un-corrected values of calculated discharge (Q in cubic feet per second) at the USGS gaging station at Cohoes. Note that two sets of ice jams occurred in this event. The first one was relatively small and the collected ice was centered in Schenectady. This first Jam was in place by 0900 15 March. A large floe of ice seen in the morning upstream of Lock 9 then joined the first floe in the afternoon, and that caused the major jam that characterized this event. Note that freezing temperatures and snowfall slowed the melting by Friday midday, and very little thawing occurred after the initial pulse that was related to breakup.
Figure 3: Discharge for ice jam interval, which shows Peak flow of 51,600 cfs that occurred at 8:00 pm (2000) on 15 March, 2007, this was a dramatic increase from 31,100 at 6:45 PM (1830) just one hour and fifteen minutes before. These data suggest that the main jam had a lifespan from about 1:45 PM to 6:45 PM or about 5 hours. This lifespan is estimated from the prominent lull in the hydrograph between these intervals, which corresponds to a period of decreased flow on what was the rising limb of the hydrograph.
Figure 4: Photograph of the leading edge of the ice jam in the Rexford Knolls looking east towards GE R&D and Knolls. Front of the ice floe is just around corner and it occurred in a location that is typical for ice floes to get jammed. This is an unusual part of the Mohawk channel because it is entirely incised into bedrock (here sandstone and shale of the Ordovician Schenectady Formation). Photograph was taken at approximately 530 PM, 15 March 2007. This ice floe extended upstream to the Stockade district of Schenectady.
Figure 5: Photograph of the Ingersoll Ave in the Stockade district of Schenectady (NY). This picture was taken at about 6:45 (1845), almost exactly at the time of the highest stage elevation in Schenectady, which was 226.5 feet.
DISCUSSION
The 15 March 2007 flooding in the Stockade was entirely related to ice jamming downstream from the city of Schenectady. During this event, discharge in the Schenectady reach of the Mohawk River probably never surpassed 45,000 to 50,000 cfs, which makes this an insignificant event with respect to expected high water.
However, the formation of the ice jam and the resulting backup of water was entirely responsible for the inundation that occurred in the Stockade. This reinforces earlier findings that the key component in these events is the evolution of stage elevation, which is not clearly related to discharge.
Note that typical flood plain maps are based on 100, and 500 yr expected elevations inferred from discharge. This last point is worth emphasizing because it is a little counter intuitive. In virtually all river floods discharge (total volume of water per unit of time typically measured in cubic feet per second) is almost directly related to the Stage Elevation (height of water). The relationship is not always linear because there are variations in flow rate, channel shape, etc. Ice jam flooding can, and should be viewed as a different phenomenon.
While it takes warm weather and high water to cause break up, the stage elevation quickly becomes decoupled once the ice jams form. When this occurs, the only effective means of observation that can lead to effective mitigation is a clear understanding of the position of the ice jam, and how stage elevations change behind the ice jam. The back up of water behind the 15 March 2007 ice jam is here estimated to have been 13 feet, but it I clear that it might easily have been higher given the cool weather and low-flow conditions.
Breakage of the ice dam at about 6:45 PM resulted in a downstream rush of water well recorded at the USGS gaging station at Cohoes. Soon after the breakup of the jam, there was a surge of water that spread quickly downstream. Nominally this surge was an additional 20,000 cfs. This outburst is inferred to have flowed through Cohoes (about 15 miles downstream from the front of the jam) between 7 and 8 PM on Thursday 15 March. Because the Schenectady County Emergency Management team noted a significant drop in the Schenectady pool at this time it is clear that this surge of water measured at Cohoes was related to the breakup of the dam that occurred in the Rexford Knolls just upstream from Lock 7. The peak discharge at Cohoes occurred at 8:00 PM and then total discharge was 51.6k cfs (cubic feet per second). This ice jam formed in the Rexford knolls, a bedrock-incised part of the Mohawk channel that is distinct and unique. This is a common jam point for ice floes, presumably because it is narrow and confined and there is no floodplain that allows the water to spread out. Our research shows that over the several hundred years, it is typical for ice jams to form on the Mohawk between the Old Burr Bridge abutments and the Rexford Knolls - the most common jam points on this entire stretch of the Mohawk (basically between Schenectady and Lock 7). As such, these ice jams pose a unique and serious hazard for the city of Schenectady (and to a lesser extent Scotia). This part of the river channel is unique because it lacks a floodplain and because it is bedrock bound.
This part of the Mohawk is relatively young having captured the main flow from the Paleo-Mohawk at about 10 Ka. Prior to this time, it is inferred that the Mohawk flowed north up the Alplaus and through what is now an abandoned channel occupied by Ballston Lake and adjacent lowlands in the paleo-channel. Although this is ancient history in the evolution of a river, it is relevant here because it provides a framework as to why this part of the Mohawk River has such a special hazard. Since capture and readjustment of the course of the Mohawk, the river has had to rapidly incise into the bedrock high that now forms the Rexford knolls. Even since settlement, this stretch of the river has been treacherous, and today we see that large ice floes have trouble getting through this narrow incised part of the channel.
This 15 March 2007 ice jam was not an unusual event. The timing, size, magnitude, and duration were typical for ice jams on the Mohawk during spring break up. It is important to note that during spring breakup floods the ice can get washed though the system when breakup is accompanied by relatively high discharge that crests well after major ice floes move through the system. However, in cases where breakup occurs during relatively low flow conditions, like the 2007 event, there is a danger that the floes will not get washed through and will instead get trapped and frozen in place. These situations have the potential for serious ice damming that can cause rather large run ups of water behind the dam. In this case, the run up is here estimated to be 13 feet, but it is entirely possible that this run up could be in excess of 20-25 feet. In this scenario, a stage elevation of 233 feet or greater would be possible in the Stockade.
This sort of extreme event (+20-25 feet) was entirely possible on 15 March 2007. In this case, an extremely rapid rise in the river level would have given emergency managers very little time for evacuation. On 15 March, the river level (stage) rose at approximately 1 foot per hour (Van Hoesen, personal Communication).If a sudden jam/dam occurred during this event that further prevented water from passing under the floe, it is possible that the rate of rise would be 2 to 4 feet per hour.
One of the most frustrating aspects of this event, and all others, is the lack of real time data available for analysis while the event transpires. Emergency management relies on first hand observations that are difficult to impossible to synthesize in a meaningful way. In fact, it is clear that if major stoppage of the water were to occur, it would only be recognized once it was too late to attempt further evacuations. Schenectady County should seek partners for the installation of a series of four or five real-time pressure transducers capable of reading instantaneous stage elevations along this critical reach of the Mohawk River (see Appendix A).
APPENDIX A: Possible locations for real-time river elevation monitors.
Real time pressure transducers measure the height of water and ice above them. They are simple devices that can provide instantaneous data to a computer, and then the data can be transmitted by the internet. Ideal locations would be below and above the most common points for ice jamming on the Mohawk. These possible locations include (right to left): Lock 7 power station, Mohawk Marina, Stockade (Union Boathouse), Lock 8.
APPENDIX B: Weather surrounding this event (modified from
www.cbs6albany.com)
|
Date |
High |
Low |
Rain |
Snow |
Weather |
|
Sunday,
3/11/2007 |
41 |
26 |
0.01" |
0.0" |
Cloudy,
light rain and fog, a gusty WNW breeze 15-25 mph, peak gust @ Albany of 30
mph |
|
Monday,3/12/2007 |
48 |
23 |
0.00" |
0.0" |
Bright
sunshine in morning,increasing cloudiness through the afternoon and evening,
mild and dry |
|
Tuesday,3/13/2007 |
55 |
28 |
0.00" |
0.0" |
Sunshine
mixed with cloudy periods, a few light showers otherwise dry, a light to
moderate southerly breeze, mild |
|
Wednesday,3/14/2007 |
65 |
46* |
0.02" |
0.0" |
Record
high minimum temperature set, hazy sunshine mixed with mid and high clouds
during the morning with temperatures soaring, low to mid 70s. Overcast
developed in afternoon, rain moved into the Capital Region from the west
after 3pm ending in most areas by 8pm, areas of dense fog during the evening
and nighttime hours with patchy drizzle and a few additional showers through
midnight |
|
Thurs,3/15/2007 |
55 |
27 |
0.53" |
0.0" |
The
high temperature occurred at 1:25am, the daytime high temperature was 46°,
the low temperature for the day of 27° occurred at 11:59 pm, rain and fog
through the morning and early afternoon, rain was moderate to heavy at times,
tapering off and ending in all but Ulster, Dutchess, Berkshire, and
Litchfield Counties by the late afternoon and the evening, rainfall amounts
ranged from 1/4" to 3/4" on average, rain changed to snow in the
higher elevations of Otsego, Delaware, and Schoharie counties during the late
morning and early afternoon before ending, trace to 1/4" amounts,
gradually falling temperatures through the day |
|
Friday,3/16/2007 |
27 |
20 |
0.51 |
10.3" |
Major
Nor'easter:
cloudy but generally dry through the morning…heavy snow, rates of
1"-3" per hour, in the Catskills by the late afternoon and into the
night, ..snowfall amounts by 11pm ranged from 3"-6" in the
Adirondacks, Mohawk valley. NNE winds ranged from 15-25 mph and produced
widespread blowing and drifting of the fine light snow, temperatures ranged
from the upper 10s through the low 20s |
|
Saturday,
3/17/2007 |
28 |
21 |
0.19" |
2.9" |
Major Nor'easter Continued: heavy snow continued, rates of
1"-3" per hour through the pre-dawn hours, sleet in areas east and
south of Albany, steadiest and heaviest snow ended by 7am with widespread
10"-18" 7"-10" in the western Adirondacks and Mohawk
Valley, with a bullseye of 18"-24" in parts of Columbia &
Dutchess Counties, |
© Geology Department, Union College, Schenectady N.Y. 12308-3107 & © Environmental Science and Policy Program, Union College, Schenectady N.Y. 12308-3107. All rights reserved. No part of the document can be copied and/or redistributed, electronically or otherwise, without written permission from the Director of the Environmental Studies Program, Union College, Schenectady NY, 12308-2311, USA.
This document can be located from http://minerva.union.edu/garverj/mohawk