This is a brief note that is a compilation of mean daily discharge on the Schoharie Creek as measured at Burtonsville by the USGS. These data are the longest record for this part of the river, but their quality is only moderate to poor(1).
Figure
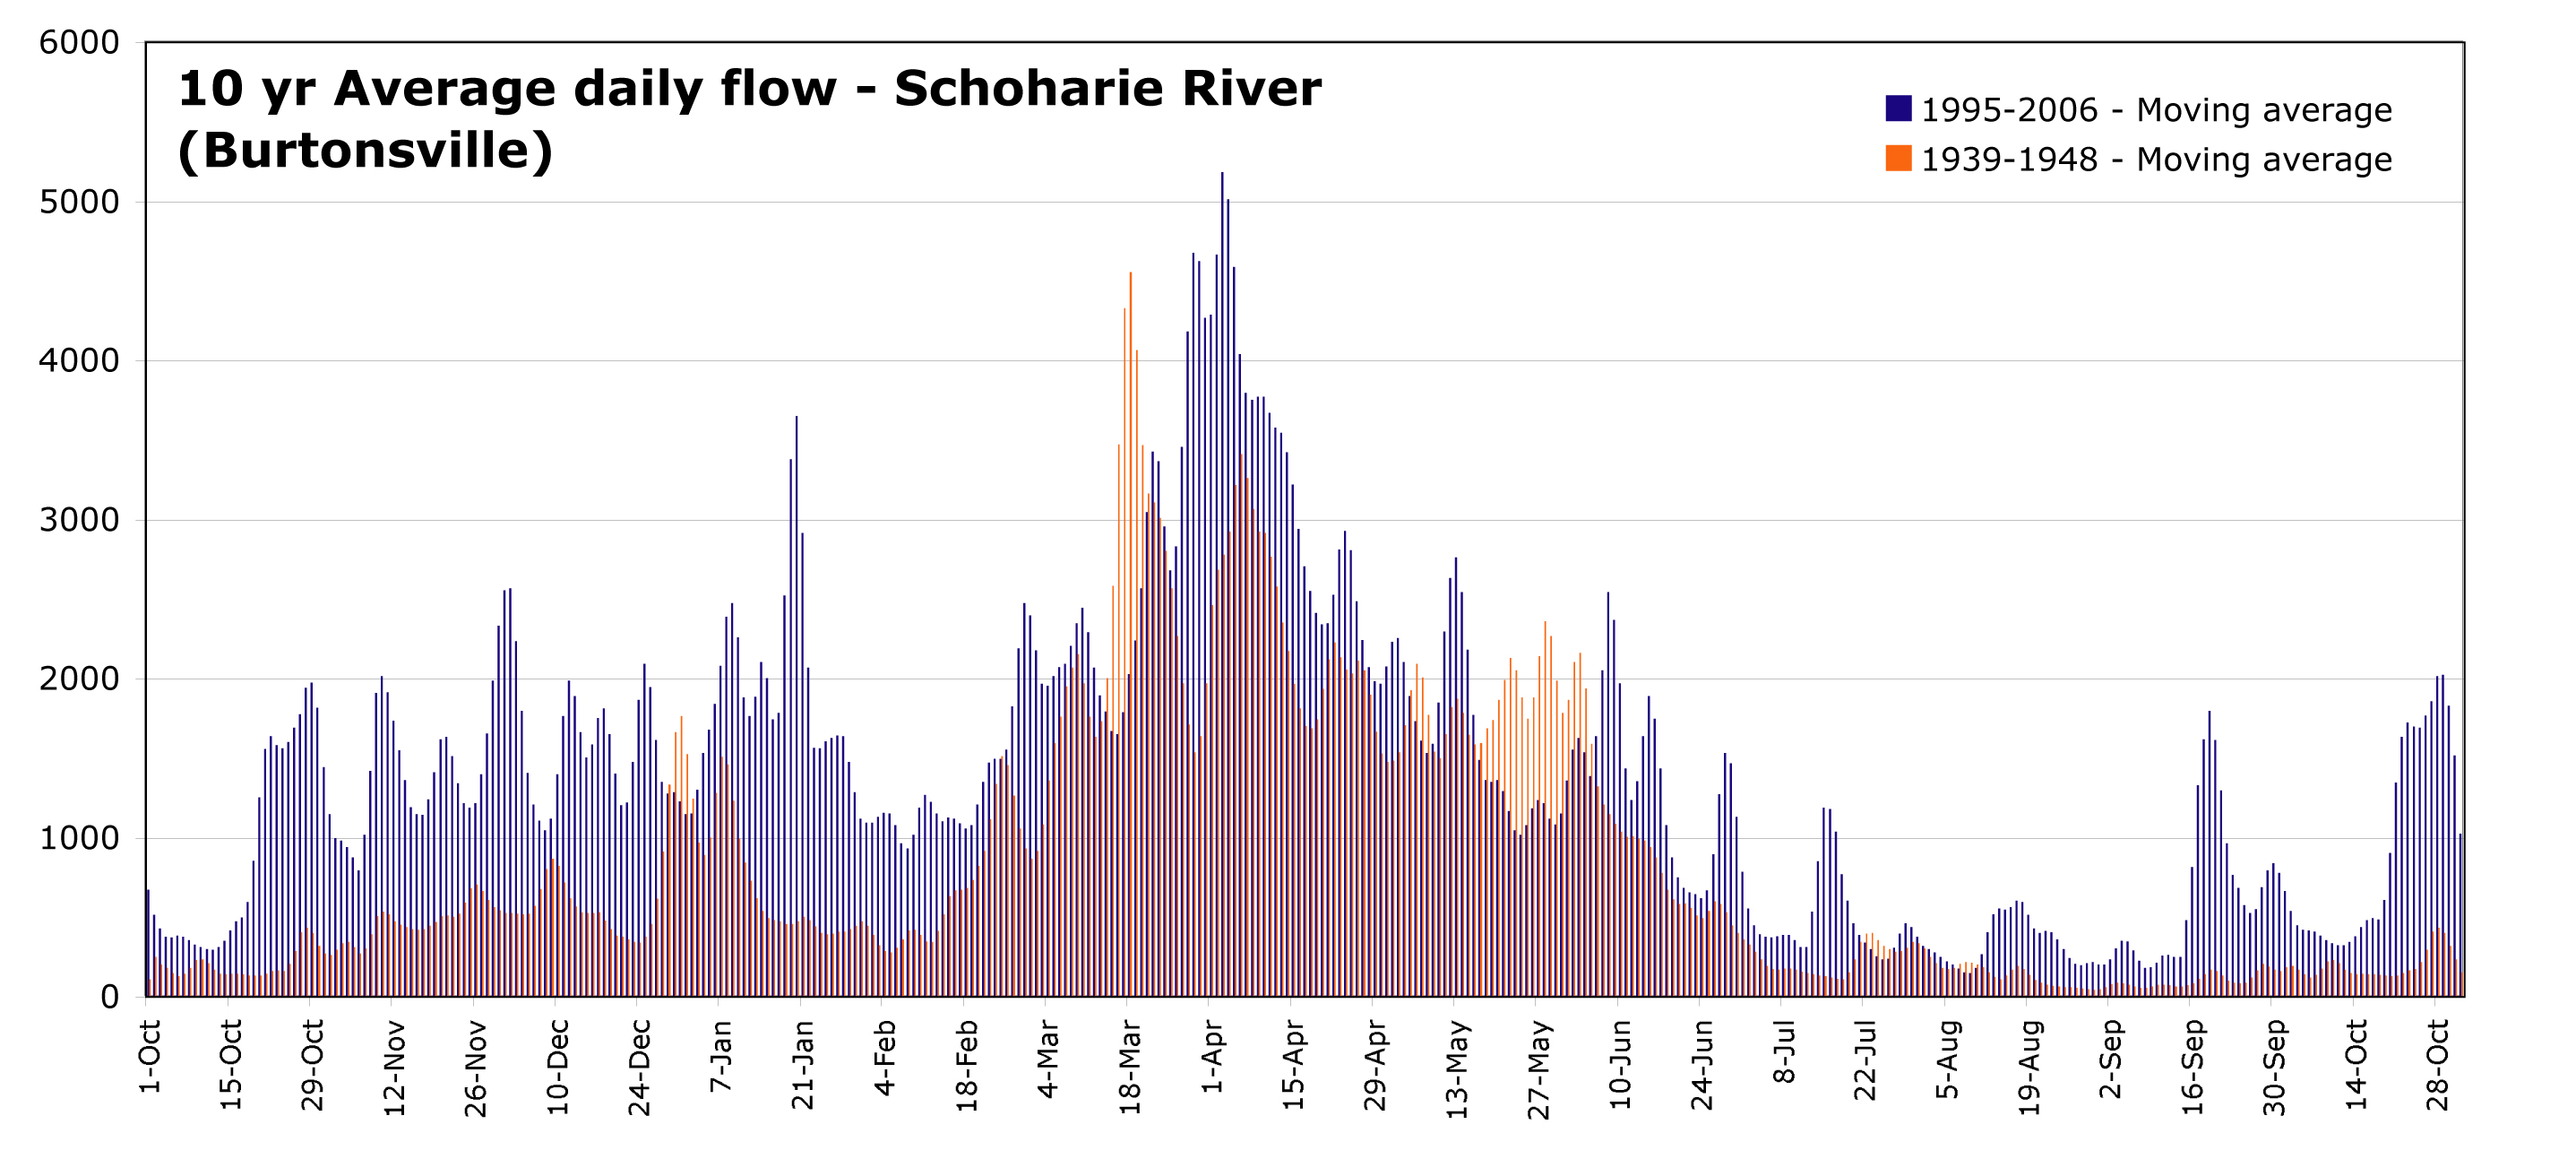
1: Daily discharge on the Schoharie Creek as measured at Burtonsville. This shows a comparison of two different decades. The blue is from 1995 to 2006, and the Red is from 1939-1948. Both lines are a 3-point moving average. This plot shows the differnce in seasonal patterns, which appear especially different in the winter and the autumn.
1) The USGS notes this about data quality: "Records fair except those for estimated daily discharges, which are poor. Regulation of flow by Blenheim-Gilboa Pumped Storage Project. Entire flow, runoff from 315 mi2, except for periods of spill, diverted from Schoharie Reservoir through Shandaken Tunnel into Esopus Creek upstream from Ashokan Reservoir for water supply of City of New York. For days of reservoir outflow greater than 10 ft3/s, see station 01350101. Satellite and telephone gage-height telemeter at station."
|