Problem Set 6 - Answers
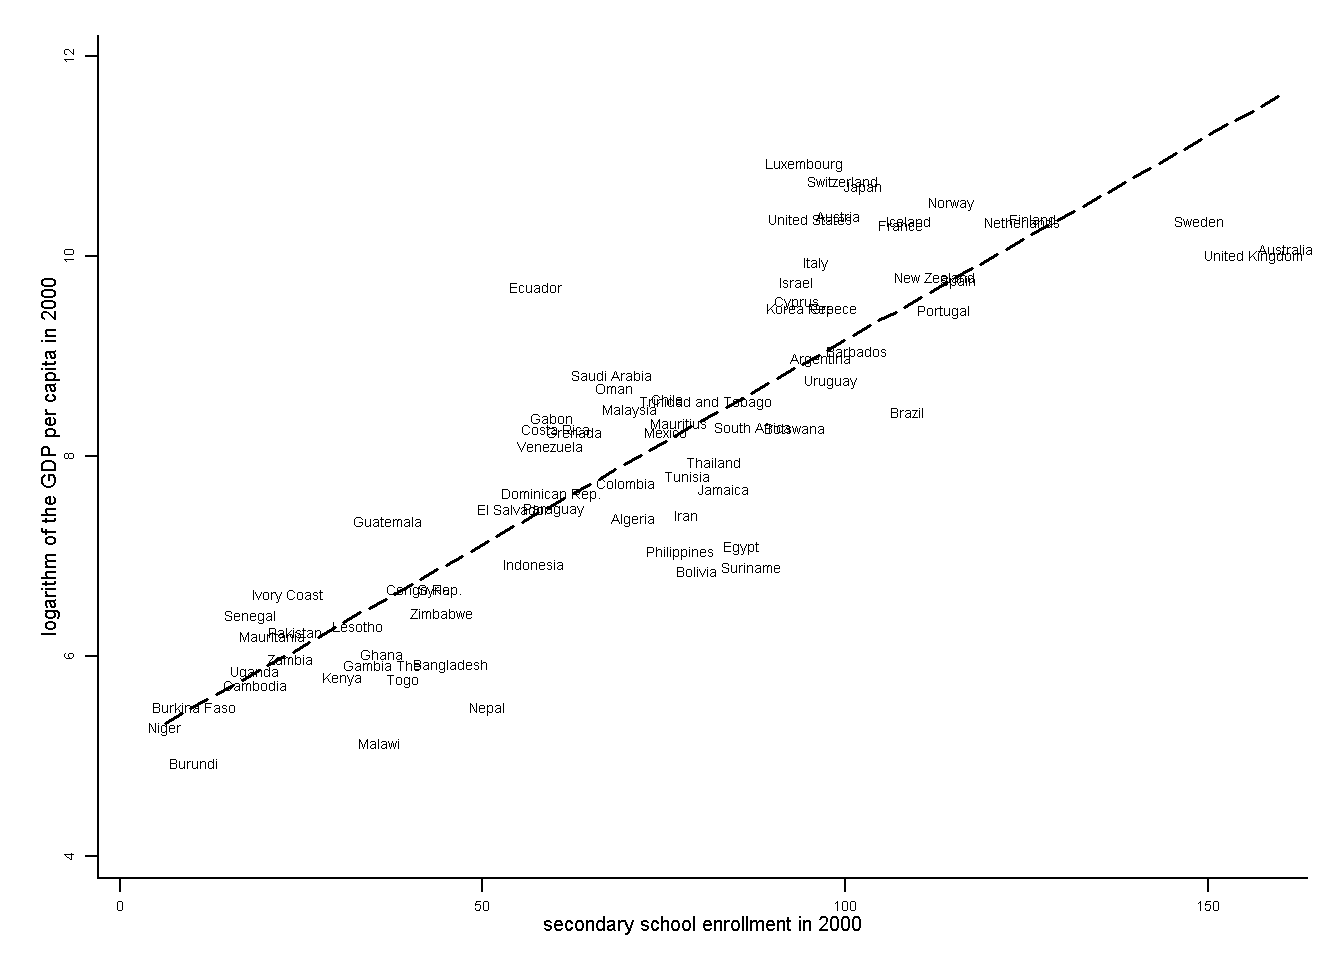
1. Examine the relationship between the log of GDP per capita in 2000 and secondary school enrollment in 2000. Do you think the causality runs from school enrollment to GDP, or vice versa? Explain.

The correlation between secondary school enrollment and per capita GDP is positive. The correlation coefficient is 0.86. This means that richer countries tend have better education. The direction of causality is not clear. It could be that more educated people in rich countries are more productive, but it could also be that only rich countries can afford to provide better education.
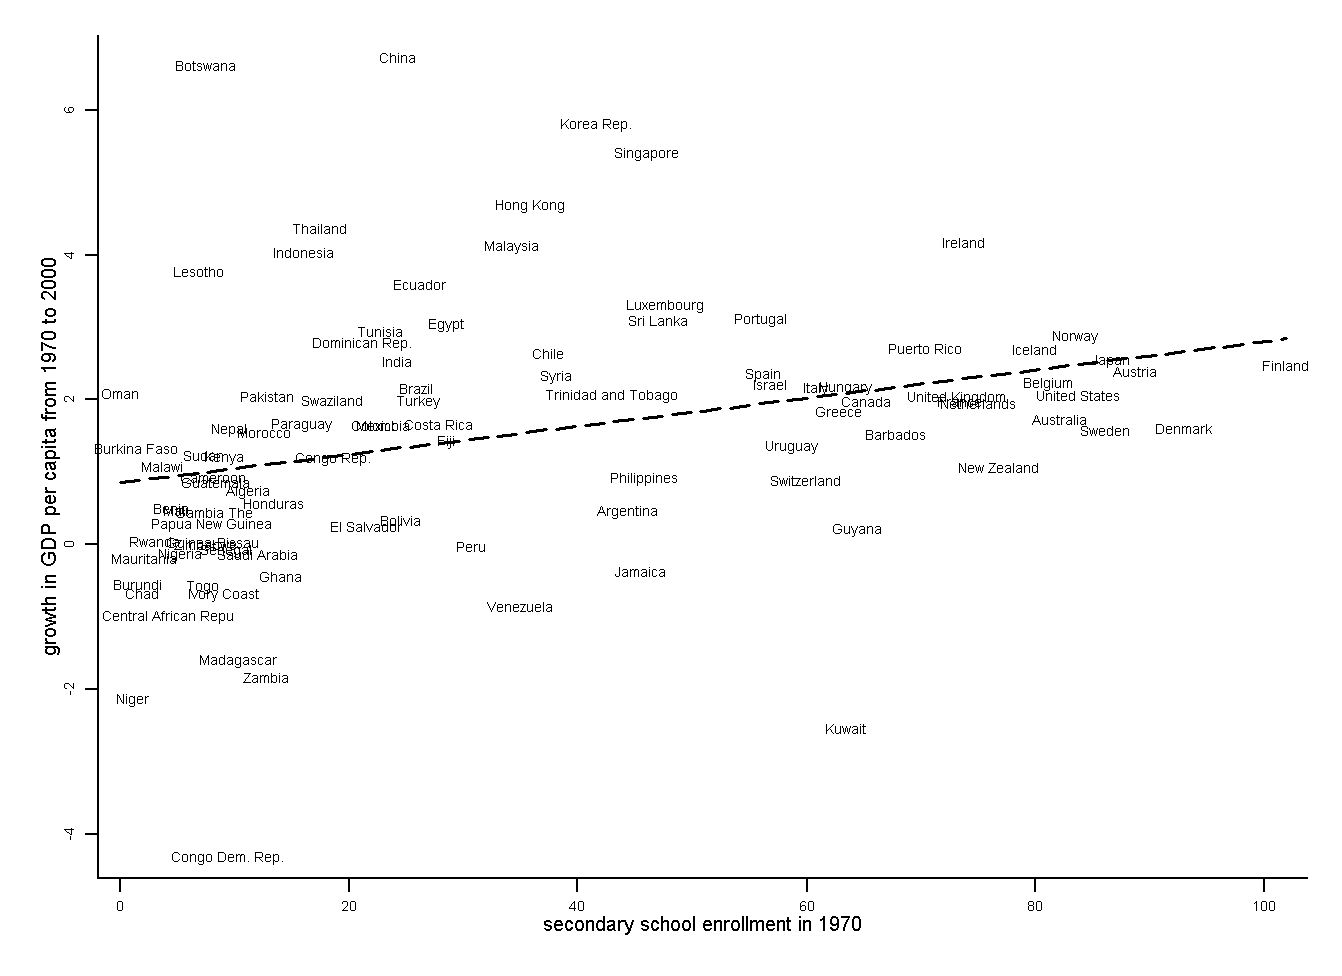
2. Calculate the annual growth rate of real GDP per capita from 1970 to 2000 (Use the formula from packet 1). Examine the relationship between the annual growth rate of real GDP per capita from 1970 to 2000 and secondary school enrollment in 1970. Which way do you think the causality runs in this case? Explain.

Countries which had higher secondary school enrollments in 1970 also had higher subsequent growth. The correlation coefficient is 0.27. In this case the causality could only run from education to growth. It is impossible that something that happened after 1970 (growth from 1970 to 2000) would cause something that happened previously (secondary school enrollments in 1970). Notice that the relationship is much weaker when we eliminate the possibility of reverse causality. This suggests that part of the relationship we found in question one is driven by income and education reinforcing each other.
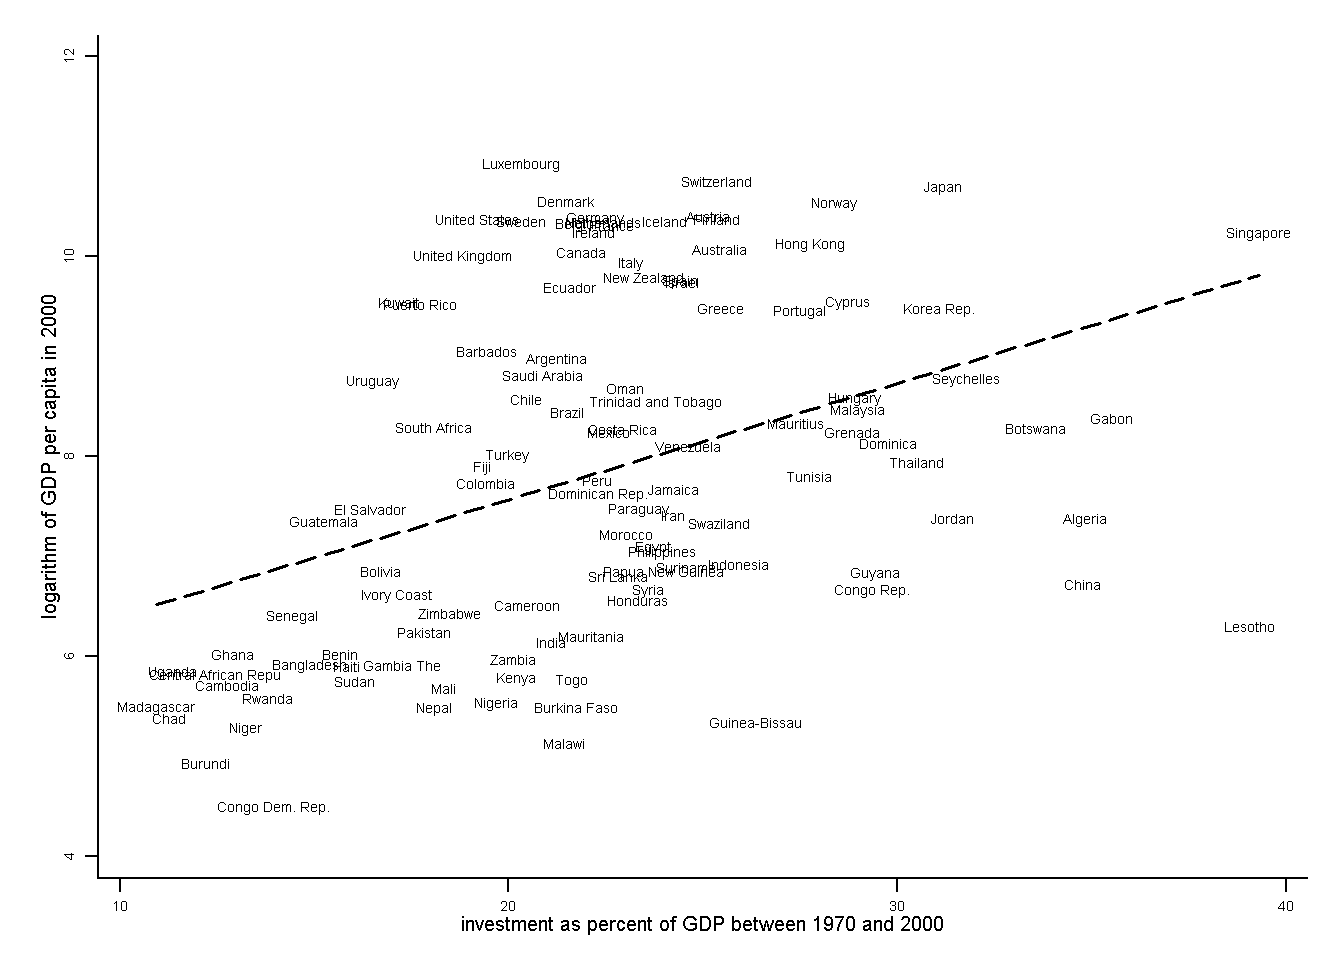
3. Examine the relationship between average investment as a % of GDP between 1970 and 2000 (Take the average of i70, i80 and i90) and the logarithm of GDP in 2000. Do rich countries invest a greater share of their income than poor countries? Is your finding consistent with the steady state of the "decreasing marginal product of capital" model we discussed in class?

There is a positive relationship between average investment as a % of GDP and the level of GDP. The correlation coefficient is 0.40. The share of income saved in rich countries tends to be greater that the share of income saved in poor countries. This is consistent with the "decreasing marginal product of capital" model, which implies that in a steady state, countries with higher savings rates have higher GDP.
4. Which way do you think runs the causality runs in question 3? Explain.
The direction of causality is not clear. It is possible that the rich countries are rich because they devote a large part of their output to investment, which in turn leads to higher output. On the other hand it is possible that rich countries can afford to save and invest because their income is more than enough to satisfy basic needs such as food and shelter.