Problem Set 5 - Answers
(due Wednesday, February 9)
1. Suppose that the consumption function is C=1+0.75(Y-T). Investment is I=2-i+0.05Y. Taxes are 2 and government expenditures are 2.5. The demand for real money is M/P=1+Y-5i. The real stock of money is 20. Answer the following questions:
a. What is the equilibrium output and interest rate?
IS:Y=C+I+G
Y=1+0.75(Y-2)+2-i+0.05Y +2.5
Y=5[4-I]
LM:
M/P=1+Y-5i
20=1+5[4-i] -5i
i=0.1=10%
Y=19.5
b. What is the level of consumption and investment? Do consumption, investment and government expenditures add up to the level of output?
C=1+0.75(Y-T)=1+0.75(19.5-2)=14.125
I=2-i+0.05Y=2-0.1+0.05*19.5=2.875
G=2.5
Indeed C+I+G=14.125+2.875+2.5=19.5=Y.
c. Suppose the government increases expenditures by $1 trillion. What is the effect on output, interest rates, consumption and investment?
G=3.5
IS: Y=5[5-i]
LM: 20=1+Y-5i
i=0.6=60%
Y=22
C=16
I=2.5
Output increases, interest rates increase, consumption increases, but investment falls.
d. Suppose that the real money demand were M/P=1+Y-45i. What happens to the slope of the LM curve? Can you explain intuitively?
The LM curve becomes flatter. (You can convince yourself that the LM curve becomes flatter by rewriting the money demand as i=1/45[-M/P+1+Y] which has much smaller slope than i=1/5[-M/P+1+Y].) This is because the money demand is now extremely sensitive to changes in interest rates. When output increases, the demand for money increases but only a small increase in the interest rate is now required to make people hold existing bonds rather than money.
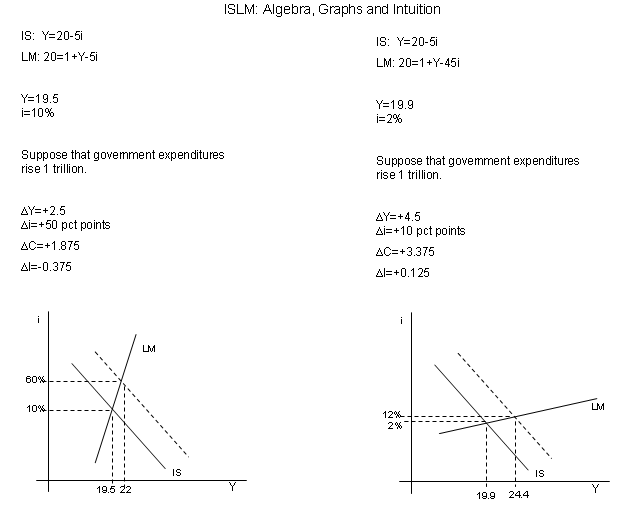
e. Given the money demand function in part d. What is the effect of a $1 trillion increase in government expenditures on output and the interest rate? How do your answers compare to those in part c? Draw the IS-LM graphs. Does your algebra agree with your graphs?
When LM is flatter, I would expect the increase in government expenditures to have a bigger effect on output than in part c and a smaller effect on the interest rate than in part c. The algebra agrees. Given the new money demand function, a $1 trillion increase in government expenditures leads to a 4.5 increase in output compared to 2.5 increase in part c. The interest rate goes from 2% to 12% compared to a 50 percentage point increase in part c.
Given the new money demand function, investment increases from 2.975 to 3.1 compared to a decline in investment in part c. In general, the effect of an increase in government expenditures is ambiguous. This is because an increase in government expenditures leads to an increase in output (which increases investment) but also to an increase in the interest rate (which decreases investment). In part c, investment declined because the effect of the interest rate increase was stronger than the effect of the output increase. In part e, where interest rate did not increase as much and output increased by more, the effect of output increase more than offset the effect of the interest rate increase.
![]()

2. Read the attached article from the Economist entitled "A working model" and answer the following questions:
a. Why would "a global glut of savings" lead to a leftward shift in the IS curve?
For a given interest rate, an increase in savings leads to lower spending. Therefore, an increase in savings leads to a leftward shift in the IS curve. An increase in savings could be interpreted as a decrease in consumer confidence (a lower c0).
b. Why would "loose" global monetary policy lead to a rightward shift in the LM curve?
For a given level of output, an increase in money supply leads to a lower interest rate. This is because people are content holding extra money only when interest rates on bonds fall. In the words of the article, "if you flood the world with money, it has to go somewhere, and some of it has gone into bonds, [pushing up prices] resulting in lower yields.”
c. According to the article, which describes current global economic conditions better: an increase in savings, or monetary expansion?
An increase in savings implies lower interest rates but also lower output. We currently have low interest rates, but as the article points out, global output has grown at "its fastest pace in almost three decades." Therefore, a leftward shift in the IS curve does not fit the facts. An increase in global money supply also implies low interest rates, but also high output. Therefore, a rightward shift in the LM curve is more consistent with the data.
d. The article points out that the two theories (increase in savings and monetary expansion) are not mutually exclusive. Show the effect of a simultaneous increase in savings and monetary expansion.
When the IS curve shifts left and the LM curve shifts right, interest rates fall but the effect on output is ambiguous. Only when the shift in the LM curve is greater than the shift in the IS curve output increases. The article points out that since output has actually increased the loose monetary policy (shift in the LM curve) is a better explanation for the low interest rates than an increase in savings (shift in the IS curve).
e. According to the article, what makes the IS-LM model especially relevant in today's world?
The IS-LM model is a model of the economy in the short run, and we assume that in the short run prices remain fixed. The article points out that the model is even more relevant in today's world as prices are kept low due to "the entry into the world economy of cheap labor in China and other emerging economies.”