Lasers in Science
Laser Spectroscopy
When electromagnetic radiation is incident on matter some fraction of the photons will usually be transmitted, passing through a sufficiently thin piece of matter without interacting, while the rest will be absorbed and will interact with the material. The particular type of interaction will depend on the energy of the photon and the structure of the matter. The energy level diagram is the crucial indicator of the type of possible interactions with radiation. The figure below shows a schematic diagram of a typical energy level diagram with closely spaced rotational and vibrational energy levels, with energy differences of 0.01 to 0.1 eV. These correspond to overall rotational motions of molecules or to the relative positional vibrations of atoms in a molecule and are the lowest atomic energy transitions. Larger energy level spacings, with energy differences of about 1 eV, are due to the various electronic states (related to the valence electron’s mean distance from the nucleus), and the even larger binding energies of the inner electrons.
Typical energy level diagram of an atom or molecule showing two electronic states and associated vibrational and rotational energy levels.
Transitions of electrons from the lower ground states to higher energy levels can occur when a photon is absorbed with the proper energy. The following Table shows the general correspondence between the type of EM radiation and the atomic or molecular transitions produced. In general, the shorter the photon wavelength, the more energy imparted to the atom or molecule that absorbs the photon.
Types of atomic or molecular transitions produced by EM radiation
|
EM Radiation (increasing energy) |
Energy level transitions |
|
Microwave |
rotational |
|
Infrared |
molecular vibrational |
|
Visible and Ultra-violet |
valence electronic |
|
X-ray |
inner electronic |
Two general types of interactions can be distinguished based on whether ionizing or non-ionizing radiation is used. Ionizing radiation consists of x-rays or gamma rays and results in the ejection of one or more electrons. Non-ionizing radiation results in a large variety of possible interactions and there is a correspondingly large number of spectroscopic techniques used to probe the radiation-matter interactions in order to learn something about the structure of the sample.
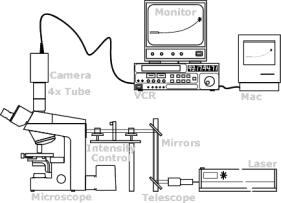
Let's imagine that we perform a spectroscopy experiment in which a laser beam of monochromatic photons is directed on a sample to study the nature of the absorbed or re-emitted radiation. Below we see a typical experimental set-up for spectroscopy. While the wavelength of the incident light is varied, the appropriate detector, monitoring either the transmitted or scattered light, records a spectrum showing the variation in the measured parameter as a function of incident wavelength. Depending on the type of interaction, we will discuss the information one can obtain from such measurements. Our presentation is by no means a complete summary of the various types of spectroscopy.
A scattering experiment in which both the transmitted and scattered (typically at 90o) EM radiation is detected. In some techniques the incident wavelength of light is continuously changed and the detected signal is recorded as a function of wavelength to produce a spectrum.
With infrared, visible or ultraviolet light incident on a sample, some small fraction of the incident photons will be absorbed and can be detected using absorption spectroscopy. Most of the absorbed energy that has caused various transitions to occur ends up heating the solution via collisions of the molecules. Measurement of the absorption spectrum, the amount of light absorbed vs wavelength of light, can be used to determine something about the chemical composition of the sample, depending on the light used.
In infrared spectroscopy, the infrared photon energies are just sufficient to excite vibrational excitations of various covalently attached atoms in a molecule. In general, IR radiation will heat such samples when photons are absorbed. Imagining that the molecular bonds correspond to springs, when the photon frequency corresponds to the spring resonant frequency there will be a large increase in the absorption. Because the ‘effective spring constant’ of a bond is specific to the type of atoms bound, IR spectra can be used to ‘fingerprint’ the sample molecules. Methyl (C-H), carbonyl (C=O), and amide (N-H) bonds, for example, each have characteristic absorption resonant frequencies that depend also on the local environment of the atoms. Because of the large number of similar chemical bonds in a macroscopic sample, IR spectra tend to be broad peaks which are the sum of many peaks (see below). One major difficulty is that water, the universal solvent in biology and a common solvent in all work, is a strong absorber of IR radiation and, since it is present in relatively enormous quantity, masks the absorption peaks due to other molecules. The use of D2O or other methods have overcome this problem. Often, scientists compare two otherwise identical samples when one variable of the environment, for example the temperature, has been changed. The information obtained from such difference measurements can be used to learn about structural changes that have occurred under these conditions.
Example IR spectrum from small ring-like molecules showing broad characteristic peaks
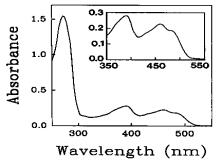
Ultraviolet-visible (uv-vis) absorption spectroscopy probes valence, or outer, electron excitations. It is precisely these interactions that determine the ‘chemistry’ of the material in that these valence electrons make up the chemical bonds between atoms. Photon energies are sufficient to excite the stronger double and triple bonds and these are the strongest contributors to the absorption. This technique is routinely used in biological research to measure the concentration of molecules since the absorption is usually proportional to concentration. Measurements are very sensitive to the overall conformation of molecules and can be used to monitor such changes as the melting of DNA (see below). Again, difference measurements are commonly used to study the specific effects of a particular perturbation on the sample.
An absorbance melting profile of DNA showing likely conformations in each region. The uv absorbance is monitored as the temperature of the DNA sample is changed.
Of the absorbed visible photons, some small fraction will be re-emitted (scattered) by the molecules with nearly unchanged photon energy (elastic scattering), but re-directed spatially. If the scattering molecules are small compared to the wavelength of light, then the scattering will be uniform in all directions (isotropic). In this case, the intensity of the scattered light will depend on the wavelength of the incident light in a characteristic and very strong way
![]() ,
,
where c is the mass concentration (kg/m3) of the scatterers, M is the molecular weight of the particles and l is the wavelength of light. Light scattering measurements, usually performed using laser light, can be used to determine the molecular weight of the scatterers. For larger molecules, the scattering is no longer isotropic, and the spatial dependence of the scattered intensity can be used to give information on the size and shape of such molecules.
Lord Rayleigh, in the 1870’s, first discovered the strong l4 dependence of scattered light and was able to answer the age-old fundamental question: why is the sky blue? The answer lies in the above equation and the fact that when we look up at the sky, the light that we see is sunlight that has been scattered from small gas and dust particles in the atmosphere. Of all the visible colors that our eyes are able to see, shades of blue have the shortest wavelength and, according to the equation, are therefore scattered with greater intensities. Hence, the sky appears blue. The same argument also explains the brilliant colors of a sunrise or sunset. In those cases we are looking towards the sun and the blue light is predominantly scattered out of the sunlight directed towards our eyes, leaving the reds and oranges to reach our eyes (see the figure).
The shorter wavelengths (blues) of sunlight are preferentially scattered by the upper atmosphere so that the sky will appear blue to an observer looking up. When the sun is on the horizon, and the blue light is scattered out, the remaining reds and oranges give the wonderful colors of sunsets and sunrises.
Some still smaller fraction of the absorbed visible light will be re-emitted as photons with a wavelength and energy different from the incident light. After a molecule absorbs a visible photon, thereby exciting its valence electron to a higher energy state, often the excited electron will lose some energy to heat via collisions with the solvent in a very short time (10-12 s). Subsequent emission of a photon (typically within a time of 10-9 s) requires, by conservation of energy, the photon to have a lower energy than the incident photon, and therefore a longer wavelength. Thus, for example, if a solution of macromolecules has blue light shining on it, some small fraction of the light will emerge, let’s say, red. This process is known as fluorescence and although the fluorescent intensity is very small compared to the incident intensity it can be detected quite easily because of its different color. Fluorescence also occurs when ultraviolet light is absorbed and visible fluorescent photons are emitted as we have already seen in our discussion of fluorescent light bulbs. The detergent industry even adds fluorescent ‘brighteners’ in order to enhance the appearance of clothing from extra visible light emitted from uv fluorescence.
In some few types of molecular systems, the excited electron finds itself in a very long-lived state as far as molecular times go, roughly 10-3 s. After this long time a photon is emitted in the process of phosphorescence. This is the way in which fireflies generate their mysterious light using the chemical compound luciferase.
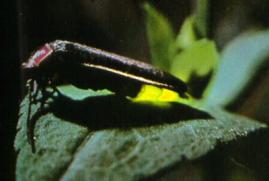
A
firefly with its glow. credit:
http://www.geocities.com/RainForest/4076/index1.html
Fluorescence spectroscopy can use 'intrinsic' fluorescent groups, known as chromophores, if they are present in the sample molecule (in proteins, the amino acid tryptophan is a good chromophore) or 'extrinsic' fluorescent molecules, known as fluors, can be attached to the molecule of interest. In either case, fluorescent light is usually detected at a 90o angle to the incident laser beam direction using some sort of color filter to only detect the fluorescent photons. The fluorescence intensity can be used as a measure of the local conformation of the molecule and measurements can often be used to detect the binding of small molecules with specific attachment sites, or the joining together of small identical proteins, such as actin, to form long thread-like filaments. Aside from its use in spectroscopy, fluorescence is also quite useful in imaging molecules in microscopy. By labeling specific molecules with a fluorescent dye and modifying a microscope with a color filter device, striking images of the arrangement of molecules otherwise too small or dilute to see are possible using fluorescence microscopy.
Three-color fluorescence image of an endothelial cell showing the tubulin (blue), endosomal pathway components (green), and actin cytoskeleton (red). credit:(http://www.probes.com/servlets/photo?fileid=g000810&id=18
Often spectroscopic techniques can study not only the intensity of the scattered or absorbed radiation, but also its polarization and time dependence. Polarization information can be quite useful in learning about the rotational motion of macromolecules. In fluorescence polarization measurements, if a brief pulse (few ns duration) of intense vertically polarized light is incident on a sample, then after absorbing a photon, parts of the molecule will be able to rotate before emitting a fluorescent photon. In doing so the polarization of the emerging fluorescence will have a horizontal component as well as a vertical component. By analyzing the time dependence of these two independent intensity components in the subsequent fluorescent burst of emission, the rotational time scales of motion of the molecules can be determined.
Another
type of dynamic spectroscopy is known as laser light scattering (or dynamic
light scattering). This technique studies the time-dependent interference
pattern produced in the scattered light and is able to measure the rates at
which the scattering molecules are moving about randomly due to the process of
diffusion (the so-called Brownian motion). No labeling of the sample
molecules is needed and no damage is sustained by the samples. The
time scales of the motions are related to the size and shape of the molecules;
the larger the molecule, the slower the motion. Studies using this method
give size and shape information directly.
Questions on Laser Spectroscopy
1. Confocal and Multi-photon Microscopy
Within the last 10 years or so many new microscope techniques have been developed that use laser illumination, including confocal microscopy and multi-photon microscopy. Laser-scanning confocal microscopy focuses a laser beam to a small spot within the sample and images light only from that spot on the detector. A pinhole in front of the detector serves to eliminate out-of-focus light from other regions of the sample, only allowing light from the focused spot to be collected. The spot is then scanned over the sample, by moving either the microscope stage or laser beam, in a raster pattern to map out the sample image, having remarkable depth and life-like appearance.
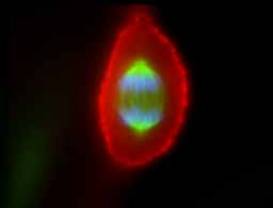
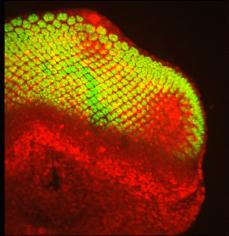
Examples of confocal microscopy: (left) an epithelial cell showing chromosomes (in blue), spindle
apparatus (green) and actin (red); (right) the developing eye of a fruit fly showing cell nuclei (red)
and nerve cells (green) credits: (http://www.itg.uiuc.edu/technology/atlas/structures/mitosis/anaphase.htm (http://laxmi.nuc.ucla.edu:8248/M248_99/intro/confocal.gif)
Multi-photon microscopy uses a pulsed laser to provide an intense beam of low energy photons that is scanned across the sample similar to confocal microscopy. When two (for two-photon microscopy) or more (for three- or multi-photon microscopy) of these photons with identical energy are simultaneously absorbed by a fluorescent molecule they can provide the same energy that a single photon with the same total energy would in the usual fluorescence microscope. The incident photon beam is tuned to the proper wavelength so that two or three or more photons, when combined, give an energy resonant with the fluorescent material, producing subsequent fluorescence emission. One important advantage of this method is that there is virtually no absorption of these lower energy photons at any other location in the sample where the beam is not focused and the density of photons is not sufficient to allow multi-photon absorption. Thus instead of using high energy photons that can damage the sample to produce fluorescence, one can use much lower energy photons and excite the fluorescent molecules through the combined energy of several photons only where the beam is focused. This technique is sensitive enough to image the intrinsic or auto-fluorescent light from the amino acid tryptophan and other fluorescent groups within the sample itself without the addition of fluorescent dyes. High-resolution, high-contrast, three-dimensional images can be obtained using these methods even with samples as thick as 0.5 mm.
2. Laser (or Optical) Tweezers
First conceived and developed in the mid 1980’s by Ashkin and colleagues at AT&T Bell Laboratories, laser tweezers is a method of using radiation pressure to trap atoms, molecules, or larger particles. In applications with the simplest possible arrangement using a single laser, particles with sizes in the range of several hundred microns down to about 25 nm can be 'trapped' and moved about using the radiation pressure of the EM radiation. How does radiation pressure trap such particles?
If a plane electromagnetic wave is incident on a particle, the radiation pressure on the particle would be such as to propel it along the direction of the beam. This is due to the fact that the photons in the beam collide with the particle and exert a net pushing force on it. This process is responsible for optical levitation, the suspension of micron-sized spheres in gravity when a light beam from below has its brightness adjusted so as to just exert enough upward force to balance the sphere’s weight. A higher intensity beam would propel the sphere upwards, while a lower intensity beam would allow the sphere to fall but at a reduced acceleration compared to free fall. This analysis does not as yet explain how a laser or optical tweezers can trap a particle.
The refraction of a focused laser beam passing through a transparent sphere. The symmetric situation results in a change in the laser beam along its propagation axis, so that there is a reaction force upwards on the sphere, towards the focus point.
Consider a transparent sphere with dimensions large or comparable to the wavelength of the EM wave that impinges on it. We learned that at an interface between different materials, EM waves are bent, or refracted, as shown above. Refraction of an EM wave is the basis for the laser tweezers. In the figure, the EM wave is shown coming to a focus above the sphere and two rays are drawn to typify the path of the wave. In this case there is a net force on the sphere toward the focus point. These longitudinal (along the beam) forces directed toward the focus point act to stabilize or ‘trap’ the particle longitudinally.
Similar to the previous figure, but with the laser beam having a typical transverse intensity profile as shown and with the sphere off center. Analysis shows that, since the intensities are not symmetric, there will be a net force not only along the beam towards the focus point, but also transversely toward the beam axis.
The above figure shows the same arrangement with the sphere off center but with the beam having a variation in intensity across its cross-sectional area. A similar analysis reveals that in addition to a force toward the focus point there will also be a transverse force directed toward the more intense portion of the beam. In a real single beam laser tweezers arrangement, the beam will have its maximum intensity at the center and the sphere would be trapped transversely to lie along the center and at the focus point.
Typical forces capable of being exerted are in the pN (10-12 N) range. This is the same order of magnitude of force that biomolecules such as myosin exert on other proteins. In order to move the trapped particle about, either the laser beam itself or the sample, sitting on a microscope stage, is moved. An experimental station uses a good quality inverted microscope with an optical port for the laser as shown below. Usually near-infrared laser light with a wavelength of about 1 mm is used with biological samples. Although the beam is invisible to the human eye and therefore needs to be detected with an infrared-sensitive CCD camera for recording, its use avoids the problems of light absorption and subsequent heating of samples that can occur when using visible light. The sample can be directly viewed through the usual microscope eyepiece using a standard visible light source of the microscope. Care must be exercised to ensure that the laser beam is not directed on the sample when viewing by eye since the beam is invisible and, for sufficiently intense laser beams, can cause damage to the eye. Laser beams have a cross-sectional intensity profile that is bell-shaped with a maximum in the center and therefore automatically act to trap particles in the transverse direction according to the above discussion.
(left) Schematic of a basic laser tweezers experimental set-up credit:(http://www.med.uni-muenchen.de/phychem/zellbio/tI/galIT1n01.html) ; (right) Laser tweezers experimental station with microscope at far end of optical table credit:(http://www.wadsworth.org/BMS/SCBlinks/WEB_MIT2/tool_mit.htg/laser2.gif)
The
maximum applied trapping force can be found as a function of the laser intensity;
the brighter the laser the stronger the trapping force.
If a sphere is attached to one end of a linear macromolecule such as DNA
or a filamentous protein like actin and the other end of the macromolecule is
immobilized, the laser tweezers can be used to stretch the molecule a given
distance and measure the minimum applied trapping force at which the sphere just
‘pops out’ of the trap (see below). Under
this condition, the applied trapping force is just equal to the force the
macromolecule is exerting on the sphere, allowing a measure of the elastic force
the macromolecule exerts.
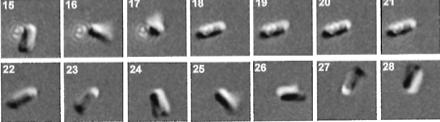
Images
of an E. coli bacteria rotating into a focused laser trap in frame 18 and
remaining trapped for four frames before shutting the trap, releasing the
bacteria credit: (Biophys J, November 1999,
p. 2856-2863, Vol. 77, No. 5)
There
are already many applications for which laser tweezers have been used.
Individual motile organisms, such as E. coli bacteria, have been trapped
by laser tweezers while they continue to live normally with flagella beating (see
above figure). Similarly laser
tweezers can be used to manipulate sub-cellular organelles within a living cell.
The IR laser passes through the cell membrane and can trap large
organelles or structures, such as individual chromosomes, that can then be moved
about. It can also be used to exert
forces directly on a cell membrane. More
quantitative measurements of forces can measure the stiffness and breaking
strength of molecules. Time
resolved measurements on trapped micron-sized plastic spheres attached to the
ends of an actin filament or a microtubule have been made to study the forces
generated when single "motor" molecules of either myosin or kinesin
move along the respective filaments. These
motility assays have recently achieved measurements at sub-piconewton force and
nanometer displacement resolutions with a time resolution of about 1 ms,
allowing the results of single molecule interactions to be studied in great
detail.
The atomic force microscope (AFM), invented in 1986 by Gerd Binnig, who also invented the scanning tunneling microscope and shared the Nobel Prize in 1986 for its discovery. The AFM provides images of the surface topography of samples with atomic resolution. It is basically a very simple instrument that uses a fine tip attached to a cantilever (a device having a 'beam' extending beyond its support, like a diving board- see the figure below) and is raster-scanned (in a particular x-y pattern) across, while in contact with, the surface to be studied. As the tip encounters small surface height changes, the cantilever is deflected proportionately due to the torque acting on it, and the height information can be recorded as a function of x-y position of the tip. This information can later be displayed in a topographical map of the surface with atomic resolution. This simple and amazing technique works because the effective springs acting between molecules on the surface are stiffer than the effective cantilever spring as we discuss below.

The heart of the atomic force microscope.
In one method to provide extremely sensitive information about the position of the cantilever, a laser beam is reflected from the cantilever surface onto a position-sensitive optical detector. The detector has several segments and the relative intensities recorded on the different portions of its surface allows a very sensitive measure of the laser beam deflection. By using a relatively long distance between the cantilever and the detector, a small angular deflection of the laser beam will result in a relatively large linear displacement (see the figure below). This scheme is called an optical lever arrangement and can be used to measure deflections corresponding to height changes of 0.01 nm (about 10% of the size of a hydrogen atom!).
An optical lever arrangement to measure small displacements of the cantilevered tip
How is a macroscopic tip able to measure the surface height with sub-atomic resolution? The essential conditions are to have an effective spring constant for the cantilever that is much smaller than the effective spring constant that holds the surface atoms together and to have the tip apply a very small (10-7 to 10-11 N) force on the surface so that the effective contact area is extremely small. In that way the cantilever will not distort the surface of the material, but will itself bend when in contact with a surface area of atomic dimensions on the material. Effective inter-atomic spring constants (stiffness) are on the order of 10 N/m, while the effective spring constant of a small piece of household aluminum foil can be made to be at least ten times smaller. Cantilevers used in AFM are usually microfabricated silicon made with integrated tips or with glued diamond tips with effective spring constants of 0.1 - 1.0 N/m. Newer tips are using the new technology of carbon nanotubes.
The most common mode for imaging samples is the constant force mode. A feedback mechanism varies the sample height so that the contact forces can be kept small and constant. Direct monitoring of cantilever deflection without feedback varying of the sample-to-cantilever height is usually not used since the larger forces occurring with large cantilever deflections can damage the surface. Samples are usually supported on a substrate, such as glass for thicker samples or cleaved mica that is flat to atomic dimensions, for thinner specimens.
A
wide variety of different samples have been studied using AFM.
Included in these are biological materials such as nucleic acids, studied
under physiological conditions so that dynamic processes of DNA-protein
interactions can be studied as they occur (in so-called "real time"),
biological membranes, in which individual lipids can be distinguished, cell
surfaces, arrays and crystals of proteins and even isolated proteins.
Another large area of application of AFM is in the area of nano-electronics, to
study the surfaces of nanometer scaled electronics. Great care must
be exercised to rule out artifacts in the images due to tip structure effects,
scan speed artifacts, lateral forces on the tip due to frictional drag as the
tip is scanned, and other problems, but the quality and the reliability of the
images are steadily improving.
![]()