Self-Assembly from Condensed Phases Exercise
A L-B trough has a 30.0 cm. wide barrier and a maximum extension of 60.0 cm (area of trough at maximum extension is thus 0.180 m2); in a classic experiment, Harkins and Boyd[1] measured the surface pressure of pentadecanoic acid (C14H29COOH, molecular mass = 242) as a film on water. In a repeat of this experiment you place a solution containing 0.250 mg of this material on the LB trough maintained in a thermostat at 18°C. You proceed to compress the film from its dilute initial condition until the film is compressed. The forces you measure on the moving barrier are:

| Surface Force (N) | Surface Pressure (N/m) | Trough Area (m2) |
| 6.600 × 10⁻⁴ | 0.00220 | 0.127 |
| 6.000 × 10⁻⁴ | 0.00200 | 0.128 |
| 5.400 × 10⁻⁴ | 0.00180 | 0.130 |
| 4.800 × 10⁻⁴ | 0.00160 | 0.133 |
| 4.200 × 10⁻⁴ | 0.00140 | 0.137 |
| 3.600 × 10⁻⁴ | 0.00120 | 0.140 |
| 3.000 × 10⁻⁴ | 0.00100 | 0.143 |
| 2.400 × 10⁻⁴ | 0.00080 | 0.146 |
| 1.800 × 10⁻⁴ | 0.00060 | 0.150 |
| 1.200 × 10⁻⁴ | 0.00040 | 0.161 |
| 6.000 × 10⁻⁵ | 0.00020 | 0.180 |
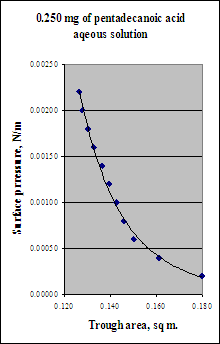
The data are plotted in terms of the surface pressure; the surface pressure is simple the force on the barrier per unit width and is calculated by dividing the measured force by the 0.300 m width of the moveable barrier. What is the molecular footprint of pentadecanoic acid in nm2/molecule from these data?
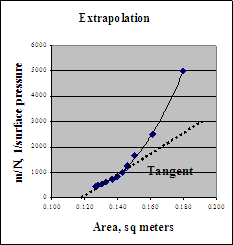
First we need to extrapolate the data to determine the Pockels limit. We do this by plotting the inverse of the surface pressure vs. area.

The extrapolated area is 0.120 m2. This is a good approximation corresponding to infinite surface pressure when all the molecules are cramped side-to-side.
We now need to find the area per molecule.
We know we added 0.250 mg of pentadecanoic acid or 0.250 × 10⁻³/242 mols = 6.205 × 10¹⁷ molecules (i.e., dividing by Avogadro’s number). The area per molecule is thus 0.120 × (10-9)2/(6.205 × 1017) = 0.290 nm2/molecule in the tightest alignment.

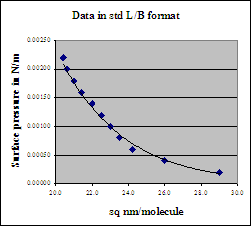
The area scale may now be appropriately plotted in the same coordinates. Indeed the inset format is the normal way Langmuir-Blodgett data are plotted.
As can be gathered by this simple example, the L-B method reveals much about the orientation of the molecules. In this format, L-B data are often referred as p-σ isotherms. Indeed schemes also exist to estimate the effective size vs. orientation of surface-active molecules from other parts of the curve[2].
Footnotes and References
[1]. W.D. Harkins and G. E. Boyd , J. Phys. Chem., 45, 20, (1941)

